Translate this page into:
Use of cluster analysis to monitor novel coronavirus-19 infections in Maharashtra, India

*Corresponding author: Sanjay Kumar, Department of Statistics, Central University of Rajasthan, Kishangarh - 305 817, Ajmer, Rajasthan, India. sanjay.kumar@curaj.ac.in
-
Received: ,
Accepted: ,
How to cite this article: Kumar S. Use of cluster analysis to monitor novel coronavirus-19 infections in Maharashtra, India. Indian J Med Sci 2020;72(2):44-8.
Abstract
Objectives:
A novel coronavirus disease (COVID-19) has been continuously spreading in almost all the districts of the state Maharashtra in India. As a part of the healthcare management development, it is very important to monitor districts affected due to novel coronavirus (COVID-19). The main objective of this study was to identify and classify affected districts into real clusters on the basis of observations of similarities within a cluster and dissimilarities among different clusters so that government policies, decisions, medical facilities (ventilators, testing kits, masks, treatment etc.), etc. could be improved for reducing the number of infected and deceased persons and hence cured cased could be increased.
Material and Methods:
In the study, we focused on COVID-19 affected districts of the state Maharashtra of India. We applied agglomerative hierarchical cluster analysis, one of data mining techniques to fulfill the objective. Elbow method was used for obtaining an optimum number of clusters for further analysis. The study of variations among various clusters for each of the variables was performed using box plots.
Results:
Results obtained from the Elbow method suggested three optimum numbers of clusters for each of the variables. For confirmed and cured cases, cluster I corresponded to the districts BI, GO, ND, PA, SI, WS, JN, CH, OS, HI, NB, JG, RT, LA, KO, AM, ST, BU, DH, AK, YTL, SN, AH, SO, AU, RG, NG, NS and PL. Cluster II corresponded to the districts TH and PU and cluster III corresponded to the district MC. For the death cases, cluster I corresponded to the districts BI, GO, ND, PA, SI, WS, JN, CH, OS, HI, NB, JG, RT, LA, KO, AM, ST, BU, DH, AK, YTL, SN, AH, SO, AU, RG, NG, NS, PL and TH. Cluster II corresponded to the district PU and cluster III corresponded to the district MC.
Conclusions:
The study showed that the district MC under cluster III was affected severely with COVID-19 which had high number of confirmed cases. A good percentage of cured cases were found in some of the districts under cluster I where six districts (GO, SI, CH, OS, SN) had 100% success rate to cure patients. It was observed that the districts TH, PU and MC under clusters II and III had severe conditions which need optimization of medical facilities and monitoring techniques like screening, closedown, curfews, lockdown, evacuations, legal actions, etc.
Keywords
Coronavirus disease-19
Cluster analysis
Box plot
Dendrograms
Data mining
INTRODUCTION
The Municipal Health Commission, Wuhan, China, on December 31, 2019, reported a cluster of transmittable pneumonia cases and it was identified as novel coronavirus disease (COVID-19). Further, other provinces of China have got spread of it and till today almost all the countries around the world have been affected due to the spread of the COVID-19. In India, the state government of Kerala reported the first case of the COVID-19 on January 30, 2020.
On March 9, 2020, the first case was confirmed in the state Maharashtra (MH) and on March 13, 2020, the state government declared an epidemic in five cities as well as the closure of commercial and educational establishments. The government banned public gatherings and events on March 14, 2020. Due to the severity of the cases in MH, the government imposed section 144 and lockdown on March 23, 2020 and further, sealed off all the borders in all the districts.
The Indian government declared this outbreak an epidemic in all the states and union territories (UTs). All educational institutions and commercial offices were shutdown. On March 22, 2020, India announced a 14 h public curfew. Further, the Indian government on March 24, 2020, ordered a nationwide lockdown for 21 days (till April 14, 2020) and after the completion of the period of this lockdown, the central government extended the lockdown up to May 3, 2020. Several types of actions were taken by the state and UT governments to control the spread of the virus COVID-19.[1] The main objective of this study is to optimize screening, closedown, curfews, lockdown, evacuations, legal actions, etc., in affected districts or areas of which will be beneficial in understanding seriousness of the spread of COVID-19 so that the state government, local governments, doctors, the police, and others involved could improve their policies, decisions, and medical facilities such as ventilators, testing kits, and masks to reduce hot spots, number of infected and deceased persons.
MATERIAL AND METHODS
Study area
MH is a state of India which is situated in the western prominent region of India. It is the third largest state by area and the second most populous state of India. It is also the most industrialized state in India. It has a tropical climate and has a hot season during March–May. It is a state which is boarded by the states Madhya Pradesh and Gujarat to the North, the states of Karnataka and Goa to the South, the state Chhattisgarh to the east, the Arabian Sea to the West, the union territory of Dadra and Nagar Haveli and Daman and Diu to the North-West, and the state of Telangana to the South-East. It has 36 districts: Ahmednagar (AH), Akola (AK), Amravati (AM), Aurangabad (AU), Beed (BI), Bhandara (BH), Buldhana (BU), Chandrapur (CH), Dhule (DH), Gadchiroli (GA), Gondia (GO), Hingoli (HI), Jalgaon (JG), Jalna (JN), Kolhapur (KO), Latur (LA), Mumbai City (MC), Mumbai Suburban (MU), Nagpur (NG), Nanded (ND), Nandurbar (NB), Nashik (NS), Osmanabad (OS), Palghar (PL), Parbhani (PA), Pune (PU), Raigad (RG), Ratnagiri (RT), Sangli (SN), Satara (ST), Sindhudurg (SI), Solapur (SO), Thane (TH), Wardha (WR), Washim (WS), and Yavatmal (YTL) which have 355 talukas, 535 cities, 63,663 villages, and 6 administrative divisions. Thirty-two affected districts are included in the study.
Methodology
We distribute the whole study into three parts. Part I consists of a collection of data and its exploratory analysis; part II consists of a performance of statistical analysis of COVID-19 data set using cluster analysis; and part III consists of deviations within clusters for each of the cases using a box plot.
Part I: Data collection and exploratory analysis
We collected data related to COVID-19 from March 9, 2020, to April 24, 2020, in MH from the website of “COVID-19 Monitoring Dashboard by Public Health Department, Government of MH; https://phdmah.maps.arcgis.com.”[2] Some related information is also supported by https://en.wikipedia.org.[3] We included 32 different COVID-19 affected districts: AH, AK, AM, AU, BI, BU, CH, DH, GO, HI, JG, JN, KO, LA, MC, NG, ND, NB, NS, OS, PL, PA, PU, RG, RT, SN, ST, SI, SO, TH, WS, and YTL.
The data consist of three variables: The total number of confirmed cases, the total number of cured/discharged cases, and the total number of death cases. The total number of confirmed, cured, and deaths cases during the period mentioned above are 6792, 840, and 299, respectively. However, the four districts MU, BH, GA, and WR have no confirmed case found. An exploratory analysis of all the three variables is given in Table 1 which summarizes basic statistics for the variables mentioned above. We did not exclude extreme values from the sample observation because these values can indicate severe situations from a health and a health management point of view. We also represent the characteristics of the three variables of the 32 districts of MH using box plots in Figure 1 and further by bar diagrams for each of the variables in Figure 2.
| Summary | Confirmed cases | Cured cases | Death cases |
|---|---|---|---|
| Min. | 1.00 | 0.00 | 0.00 |
| 1st Qu. | 2.75 | 0.00 | 0.00 |
| Median | 16.50 | 2.00 | 1.00 |
| Mean | 212.25 | 26.25 | 9.34 |
| 3rd Qu. | 39.75 | 13.50 | 2.00 |
| Max. | 4447.00 | 413.00 | 178.00 |
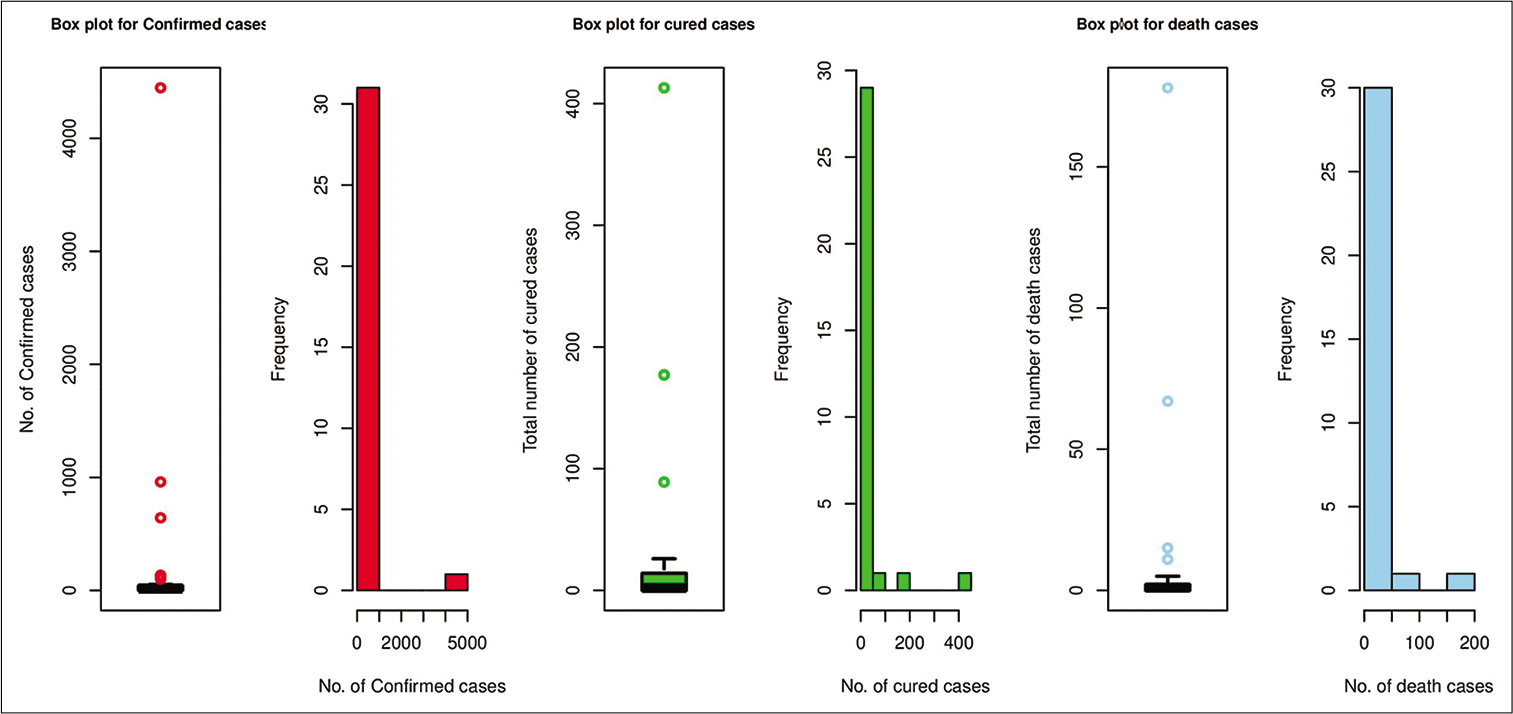
- Box plots and histograms for the three cases: Confirmed cases, cured cases, and death cases of coronavirus disease -19.
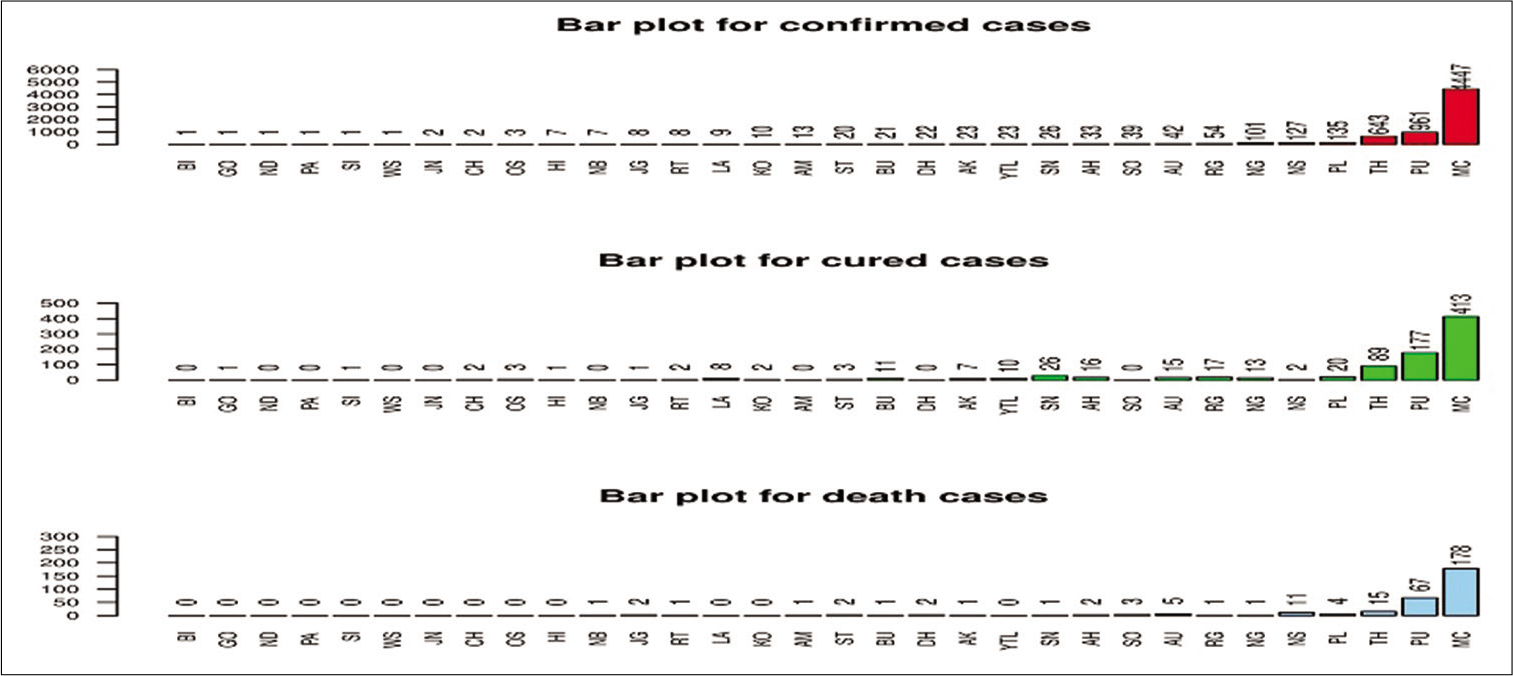
- Bar diagrams for number of confirmed, cured, and death cases of coronavirus disease -19.
Part II: Cluster analysis (CS)
CS is one of the data mining techniques which clusters the sample observations into classes depending on the essential similarities within a class and dissimilarities among different classes found in the data set.[4-6] Ward[7] suggested agglomerative hierarchical cluster analysis which is based on a squared Euclidean distance. The ward method is the simplest and the most commonly used method which requires no prior assumption and uses the analysis of variance to calculate distances among clusters.[8] In this study, we used the R software (version R i386 3.6.3) to perform the cluster analysis. We scaled the data set before carrying out the cluster analysis. Elbow method using R software was used for getting an optimum number of clusters for each of the variables which are given in Figure 3a-c.
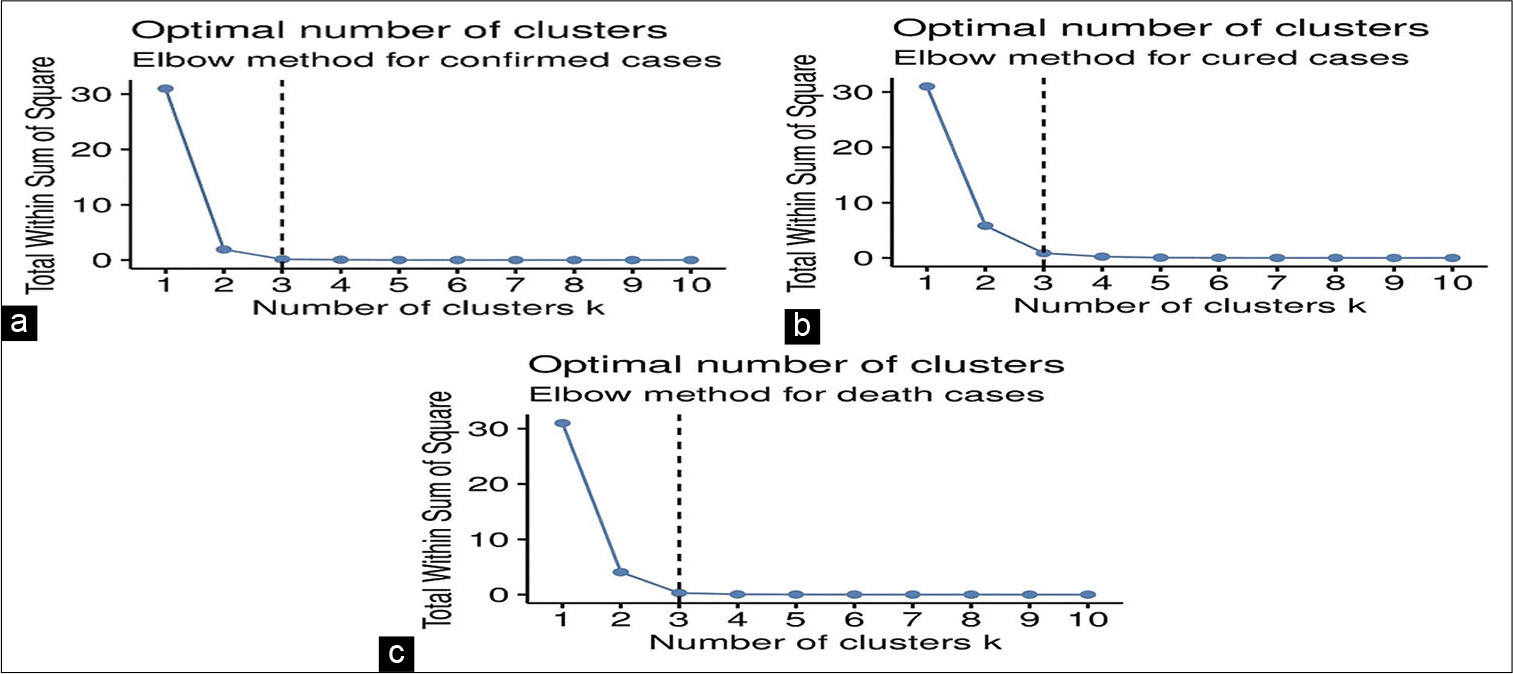
- (a-c): Elbow method plots for obtaining optimum number of clusters.
Part III: Analysis using box plot
To measure the deviation within clusters for each of the variables, we analyzed it statistically using R software and for the purpose, we used box plots for representing the deviation in each of the cases. The observations related to the variables are skewed which were shown by histograms in Figure 1, so the median is more appropriate to use.[9] It is well known that the box plot is the most powerful tool for showing median, range, as well as the shape of the underlying distribution of the data.
RESULTS
From the Table 1 and Figure 2, it was seen that there was a great difference between minimum and maximum number of observations for all of the variables. Further, from Figure 1, it was observed that the data related to each of the variables was skewed. Extreme observations were also present in the data set.
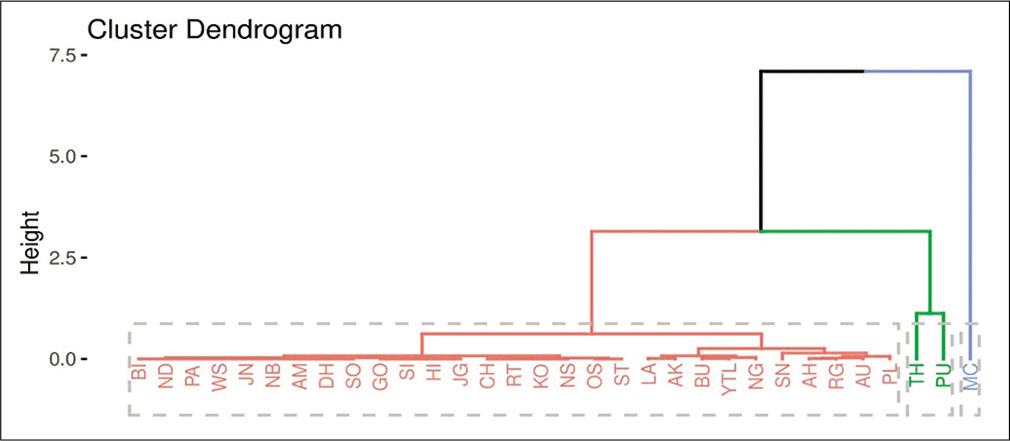
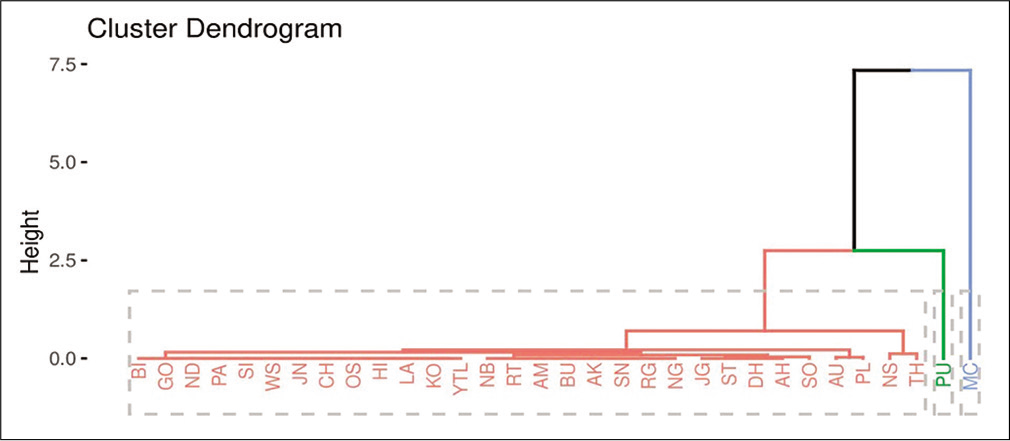
Results obtained in Figures 3a-c suggested three optimum numbers of clusters for each of the variables. The dendrograms of cluster analysis calculated on the basis of all the variables separately for the COVID-19 data set are given in Figures 4-6, respectively for confirmed cases, cured cases, and death cases for the visual representation. For confirmed cases, cluster I corresponded to the districts BI, GO, ND, PA, SI, WS, JN, CH, OS, HI, NB, JG, RT, LA, KO, AM, ST, BU, DH, AK, YTL, SN, AH, SO, AU, RG, NG, NS, and PL. Cluster II corresponded to the districts TH and PU and cluster III corresponded to the district MC. For cured cases, cluster I corresponded to the districts BI, GO, ND, PA, SI, WS, JN, CH, OS, HI, NB, JG, RT, LA, KO, AM, ST, BU, DH, AK, YTL, SN, AH, SO, AU, RG, NG, NS, and PL. Cluster II corresponded to the districts TH and PU and cluster III corresponded to the district MC. For the death cases, cluster I corresponded to the districts BI, GO, ND, PA, SI, WS, JN, CH, OS, HI, NB, JG, RT, LA, KO, AM, ST, BU, DH, AK, YTL, SN, AH, SO, AU, RG, NG, NS, PL, and TH. Cluster II corresponded to the district PU and cluster III corresponded to the district MC.
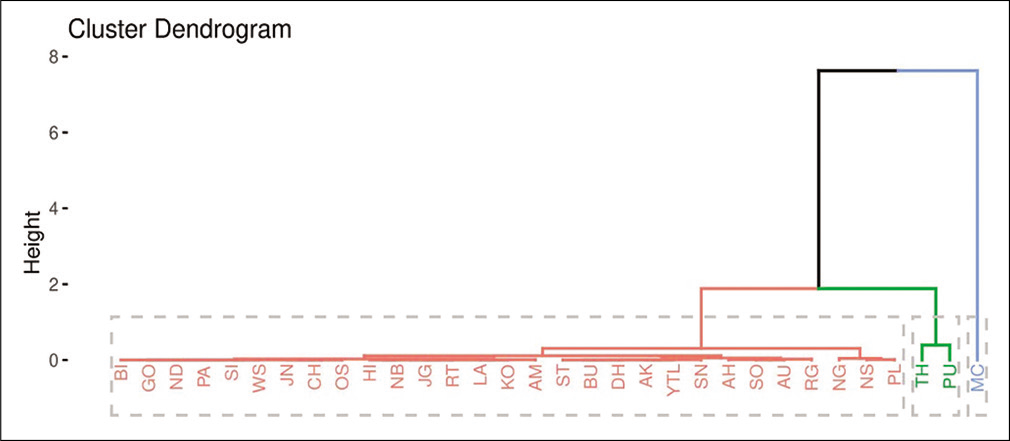
- A dendrogram showing clustering of districts for confirmed cases of coronavirus disease-19.
- A dendrogram showing clustering of districts for cured cases from coronavirus disease-19.
- A dendrogram showing clustering of districts for death cases from coronavirus disease-19.
The box plots [Figure 7] were constructed to judge variation in COVID-19 severity of each case by clusters I-III. Here we considered a district as a severe zone if there are 15 or more than 15 confirmed cases in a district.
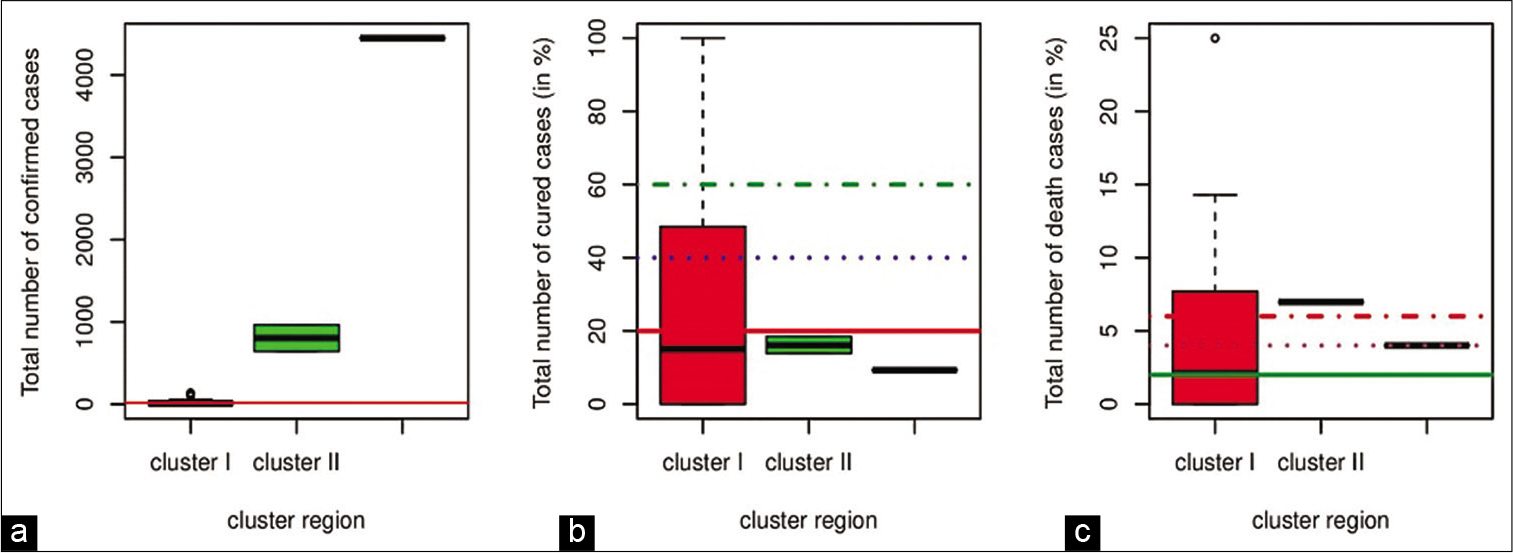
- Box plot of variation in (a) confirmed cases (b) cured cases (in %) and (c) death cases (%).
DISCUSSION
52% of the districts under cluster I and all the districts under clusters II and III were in the severe zone. MC under cluster III had high severity of confirmed cases (65.47%). Further, we found a percentage of cured and death cases in different districts. We divided the whole districts into four zones – below 20%, 20–40%, 40–60%, and above 60% and below 2%, 2–4%, 4–6%, and above 6%, respectively according to the percentage of cured and death cases. The trends shown in box plots for cured cases of COVID-19 showed severity in clusters II and III where only less than 20% of patients were cured. Districts under cluster I had cured cases lie in all the zones i.e., below 20%, 20–40%, 40–60%, and above 60%, where some of the districts had 100% cured cases. Similarly, a district under cluster I, death percentage lied in all the zones i.e., below 2%, 2–4%, 4–6%, and above 6%, where JG had 25% death cases. There were more than 6% of the death cases in PU under cluster II. MC under cluster II had 4% death cases. MC under cluster III for the confirmed cases as well as for the cured cases, PU under cluster II and MC under cluster III for the death cases are observed single location and hence represented as single lines in box plots.
CONCLUSIONS
In this study, we performed an agglomerative hierarchical cluster analysis to classify districts of MH on the basis of the various status of COVID-19. The technique grouped 32 different affected districts into three clusters (I-III) for each of the cases. About 50% of the districts under cluster I, all the districts under clusters II and III were affected severely with COVID-19, where the district MC under cluster III has a high number of confirmed cases. The box plot shows variations among different clusters of the three cases. The trend in box plot showed a good percentage of cured cases in some of the districts under cluster I where six districts (GO, SI, CH, OS, and SN) had a 100% success rate to cure patients. It was observed that the districts under clusters II and III had severe conditions which need optimization of monitoring techniques (screening, closedown, curfews, lockdown, evacuations, legal actions, etc.) which could help the government, doctors, the police, and others involved in making improvement government policies, actions, etc. TH, PU, and MC needed more monitoring (closedown, curfews, lockdown, evacuations, legal actions, etc.), to reduce the number of infected persons.
Declaration of patient consent
Patient’s consent not required as there are no patients in this study.
Financial support and sponsorship
Nil.
Conflicts of interest
There are no conflicts of interest.
References
- India and COVID-19 pandemic-standing at crossroad! Indian. J Med Sci. 2020;72:1-2.
- [CrossRef] [Google Scholar]
- Available from: https://www.phdmah.maps.arcgis.com [Last accessed on 2020 Apr 25]
- Available from: https://www.en.wikipedia.org [Last accessed on 2020 Apr 25]
- Using cluster analysis for medical resource decision making. Med Decis Mak. 1995;15:333-47.
- [CrossRef] [PubMed] [Google Scholar]
- Cluster analysis and related techniques in medical research. Stat Methods Med Res. 1992;1:27-48.
- [CrossRef] [PubMed] [Google Scholar]
- Hierarchical grouping to optimize an objective function. J Am Stat Assoc. 1963;58:236-46.
- [CrossRef] [Google Scholar]


