Translate this page into:
Eosinophilia: Clinical experience from a tertiary care center in India
 , Ranveer Singh Jadon1, Prerna Garg1, Umang Arora1, Ushasi Saraswati2, Ritik Mahaveer Goyal3,, Mukul Aggarwal4, Animesh Ray5, Arvind Kumar5, S. N. Dwiwedi6, Aparna Ningombam7, Ashutosh Biswas1, Naveet Wig1
*Corresponding author: Ritik Mahaveer Goyal, Department of Internal Medicine, All India Institute of Medical Sciences, New Delhi, India. ritik5678@gmail.com
-
Received: ,
Accepted: ,
How to cite this article: Narayan A, Jadon RS, Garg P, Arora U, Saraswati U, Goyal RM, et al. Eosinophilia: Clinical experience from a tertiary care center in India. Indian J Med Sci 2023;75:76-81.
Abstract
Objectives:
Eosinophilia is a prevalent laboratory abnormality that we encounter in day-to-day practice both in outpatient and inpatient settings. The causes range from primary to secondary spanning from an allergic response to clonal neoplastic proliferations. Identifying an etiology may be challenging in many cases and may sometimes require extensive evaluation. We aimed to find the clinical and etiological profile of patients with eosinophilia and the association of eosinophilia with end-organ involvement and IgE levels.
Material and Methods:
The study was designed as a cross-sectional study over a period of two years (2019 to 2020). The study setting was outpatient and inpatient medical wards of a tertiary care center in north India. A detailed history and clinical examination were done on patients with eosinophilia detected in blood counts. Standard diagnostic protocols guided by positive clinical and diagnostic tests were followed to find etiologies in patients with eosinophilia.
Results:
In our study, the most common cause overall and in each category of eosinophilia was parasitic infections (35%) followed by allergic disorders (29.3%). The most frequent symptoms were cough (32%), generalized weakness (25.5%), dyspnoea (24%), and a history suggestive of atopy (21%). On clinical examination, the most common finding was rhonchi or wheeze (24.5%). The most commonly affected end-organ was the lungs (13.2%) followed by the skin (4.7%).
Conclusion:
Parasitic infections are the most common cause of eosinophilia in our population. IgE levels correlate with a diagnosis of atopy or asthma and do not show a correlation with AEC. The lungs were the most frequently involved as end-organ in eosinophilia followed by the skin. We found no significant association between end-organ involvement and the degree of eosinophilia which highlights the importance of working up symptomatic patients for end-organ damage irrespective of the eosinophil count.
Keywords
Eosinophilia
Immunoglobulin E
Hypereosinophilic syndrome
Parasitic infection

INTRODUCTION
Eosinophilia is a frequently encountered abnormality in clinical practice. In a healthy individual, eosinophils constitute 3-5% of the total leukocyte count (350-500 cells/µL). A differential eosinophil count of more than 5% or an absolute eosinophil count (AEC) of 500 cells/µL or higher constitutes eosinophilia and merits further evaluation.[1]
Although clinical history guides an approach for patients with eosinophilia, sometimes a significant set of investigations are required to determine the cause and the possible role in disease presentation. A disorder presenting with a raised eosinophil count may be primary, where there is disordered growth and replication of eosinophils, or secondary, as a response to drugs, malignancy, allergy, or infections.[2]
Identifying an etiology for eosinophilia can be challenging in some cases; the cause of eosinophilia remains unknown in one-third of the cases despite extensive evaluation. Additionally, the etiological spectrum may change according to social and geographical variations. We studied the clinical and etiological profiles of patients with eosinophilia to identify the spectrum of etiology. At the same time, we also analyzed the organ systems commonly affected in cases of eosinophilia in Indian patients. Our study also analyzed the distribution of IgE levels among the severity of eosinophilia.
MATERIAL AND METHODS
We conducted a cross-sectional study over a period of 2 years (2019–2020) in the outpatient clinics and medical wards at a tertiary care center in Delhi, India. Consecutive patients with peripheral blood eosinophilia (AEC > 500/µL or a differential count > 5%) with the age of 14 years or above were included after informed consent.
Eosinophilia was categorized based on the AEC into mild (≤1500/mL), moderate (1500–5000/mL), and severe (≥5000/mL) eosinophilia.[1] Hypereosinophilia (HE) was defined as an AEC ≥ 1500/mL on two consecutive occasions at least 1 month apart, or the demonstration of tissue HE on pathological examination.[2] Hypereosinophilic syndrome was defined as the presence of severe eosinophilia with organ damage attributable to tissue eosinophilia, after the exclusion of other diagnoses.[3] Standard guidelines were followed for the diagnosis of asthma,[4] allergic bronchopulmonary aspergillosis (ABPA),[5] immunoglobulin G4-related disease,[6] allergic rhinitis,[7] atopic dermatitis,[8] and drug reaction with eosinophilia and systemic symptoms (DRESS) syndrome.[9] Histopathological diagnoses such as Kimura disease were based on slide reviews by experienced pathologists.[10] Drug-induced eosinophilia was diagnosed in patients who developed eosinophilia during hospitalization temporally correlating with prescription of implicated drugs and confirmed by resolution of eosinophilia on stopping suspected drugs (if feasible).[11] Drug-induced eosinophilia was diagnosed only if the criteria for DRESS were not met.
Detailed history and clinical examination relevant to the etiological assessment and organ dysfunction were performed. Patients were investigated with complete blood counts, peripheral blood smear, stool examination for parasites (repeated for 3 days), and testing for microfilariae infection.[12] The latter included peripheral blood smear staining using acridine orange and giemsa, microfilariae antigen detection, and a quantitative buffy coat. Further, the diethylcarbamazine (DEC) provocation test was performed for increasing sensitivity of detection of microfilaria antigen.[13] All cases of moderate or severe eosinophilia (and mild eosinophilia if clinically indicated) were evaluated with a rationalized second set of investigations for etiology and organ dysfunction [Table 1]. Renal involvement was accessed using kidney function test, urine eosinophils and, if indicated, kidney biopsy. Serum immunoglobulin E (IgE) (Phadiatop technology), bone marrow study, cytogenetics, Janus Kinase 2, and screening for platelet-derived growth factor receptor alpha and platelet-derived growth factor receptor beta by fluorescent in situ hybridization were done where required.[14] Eosinophilia was considered idiopathic when the first set of investigations was non-contributory, bone marrow examination and cytogenetics were normal, and drug-induced eosinophilia was unlikely.
| Symptoms and signs assessed | Organ system accessed | Investigations performed |
|---|---|---|
| Dyspnea, wheeze, rhonchi, and crepitations | Lungs, and pulmonary system | PFT, CXR, CT scan, BAL, and lung biopsy |
| Orthopnea, PND, abnormal apex, LPH S3, S4, and murmur |
Heart and cardiovascular system | ECG, ECHO, MRI, and serum cardiac markers |
| Dyspepsia, gastritis, hemoptysis, and hepatomegaly | GI system | UGI endoscopy and USG abdomen |
| Splenomegaly | Reticuloendothelial system | Bone marrow |
| Focal neurological deficits | CNS | Brain and spinal cord MRI, CSF studies, NCV, EMG, and muscle biopsy |
| Rash | Skin | Biopsy |
PFT: Pulmonary function test, CXR: Chest X-ray, CT: Computed tomography, BAL: Bronchoalveolar lavage, PND: Paroxysmal nocturnal dyspnea, LPH: Left parasternal heave, ECG: Electrocardiogram, ECHO: Echocardiography, GI: Gastrointestinal, UGI: Upper gastrointestinal, USG: Ultrasound, MRI: Magnetic resonance imaging, CNS: Central nervous system, CSF: Cerebrospinal fluid, EMG: Electromyography, NCV: Nerve conduction velocity
The normality of distributions was confirmed using the Shapiro–Wilk test. If the data were normally distributed, it was expressed as mean ± standard deviation (SD), otherwise, it was presented as median with interquartile range. Association between qualitative variables was tested using the Chi-squared/Fisher’s exact test. For comparing the quantitative variables between the three groups, oneway analysis of variance or Kruskal–Wallis tests were used as appropriate, and subsequently, multiple comparison tests (with Bonferroni correction) were performed to identify the pairs of groups having significantly different results. Correlation among quantitative variables was measured using Pearson’s correlation coefficient or Spearman’s correlation coefficient. P = 0.05 or less was considered significant. All statistical analysis was done using STATA.
RESULTS
A total of 106 patients were recruited during the study period, of whom the full baseline workup could be done in 97 patients, while partial workup was available for the rest. The mean age of the study population was 35.4 (±1.3) years and included 60 males (56%). The mean ± SD AEC was 2569 ± 188 cells/µL (range 382–27,588 cells/µL). Among a total of 106 patients with eosinophilia, 62 (58.8%) patients had mild eosinophilia, 31 (29.2%) had moderate, and 13 (12%) patients had severe eosinophilia.
Among the study population, the most frequent symptoms were cough, generalized weakness, dyspnea, and a history suggestive of atopy [Table 2]. On clinical examination, the most common finding was rhonchi or wheeze. A minor percentage of the population had nasal polyp, crepitations, and abdominal mass [Table 2]. Of the 106 patients analyzed, two had diabetes mellitus, three had hypothyroidism, and one had chronic kidney disease as well as hypertension.
| Symptom | Frequency in number and percentage n(%) | Sign | Frequency in number and percentage n(%) | |
|---|---|---|---|---|
| Cough | 34 (32.1) | Rhonchi | 26 (24.53) | |
| Generalized weakness | 27 (25.5) | Pallor | 17 (16.04) | |
| Dyspnea | 26 (24.5) | Pedal edema | 5 (4.71) | |
| Allergic rhinitis | 23 (21.7) | Lymph node swelling | 4 (3.78) | |
| Wheeze | 21 (19.8) | Icterus | 3 (2.83) | |
| Fever | 17 (16) | Nasal polyp | 3 (2.83) | |
| Abdominal pain | 12 (11.3) | Crepitations | 3 (2.83) | |
| Swelling | 10 (9.4) | Splenomegaly | 1 (0.94) | |
| Rash | 9 (8.5) | |||
| Diarrhea | 8 (7.6) | |||
| Itching | 7 (6.6) | |||
| Headache | 6 (5.6) | |||
| Asymptomatic | 13 (12.3) | |||
Hematological and biochemical parameters, except for TLC, were within reference range for the majority of the study population and did not differ across the severity groups [Table 3]. We calculated non-eosinophil leukocyte count (TLC-AEC) to estimate if the difference in TLC between the groups is entirely attributable to the difference in AEC. This was significantly different across the groups, and post hoc analysis identified that those with moderate eosinophilia had higher non-eosinophil leukocyte counts (P = 0.01). Levels of immunoglobulin IgE were measured in 50 patients and were elevated in 44 patients (88%). Sixteen of these 50 patients had an allergy, with a trend toward higher IgE levels in these patients (median 1630 vs. 851 IU/mL, P = 0.06) compared to those without allergy. The median IgE levels (IU/mL) were not significantly different between mild, moderate, and severe eosinophilia (P = 0.325) [Figure 1].
| Investigation | Overall | Mild eosinophilia (n=62) | Moderate eosinophilia (n=31) | Severe eosinophilia (n=13) |
P-value for comparison across groups |
|---|---|---|---|---|---|
| Age (years) | 35.4±1.3 | 32.2±1.6 | 42.42±2.2 | 34.2±4.8 | 0.36 |
| Male (%) | 60 (56%) | 39 (63%) | 16 (52%) | 5 (38%) | 0.26 |
| Hb (gm/dL) | 12.51±2.46 | 12.69±2.4 | 12.6±2.26 | 11.24±3.03 | 0.385 |
| TLC (/mL) | 8730 (6860–8730) | 6980 (5600–9100) | 11100 (7950–16200) | 21400 (18060–29520) | <0.001 (P<0.05 for all comparisons) |
| Leucocyte count (/µL) excluding eosinophils | 6771 (5224–9630) | 6270 (5096–8200) | 8040 (5760–13028) | 7782 (5137–10370) | 0.028 (P=0.01 for mild vs. moderate; 0.56 for mild vs. severe; 0.49 for moderate vs. severe) |
| Platelet (^108/mL) | 2.14±0.96 | 2.19±0.87 | 2.2±0.77 | 1.96±1.54 | 0.492 |
| Total bilirubin (mg/dL) | 0.40 (0.3–0.7) | 0.5 (0.3–0.7) | 0.5 (0.3–0.4) | 0.35 (0.3–0.4) | 0.148 |
| AST (IU/L) | 28 (20–38) | 26 (19–38) | 28 (22–41) | 32 (27–37) | 0.645 |
| ALT (IU/L) | 26 (15–47) | 24 (15–44) | 37 (16–57) | 35 (21–40) | 0.442 |
| ALP (IU/L) | 241 (186–327) | 235 (185–300) | 251 (190–394) | 286 (254–377) | 0.134 |
| Urea (mg/dL) | 21 (18–31) | 21 (18–30) | 22 (19–31) | 23 (19–28) | 0.903 |
| Creatinine (mg/dL) | 0.8 (0.7–0.9) | 0.8 (0.65–0.9) | 0.7 (0.7–0.9) | 0.8 (0.7–1) | 0.786 |
| IgE level (IU/mL) (n=49) | 1014 (518–3106) | 951 (504–2812 | 1193 (127–5000) | 4000 (662–5709) | 0.32 |
AST: Aspartate transaminase, ALT: Alanine transaminase, ALP: Alkaline phosphatase, Hb: Hemoglobin, TLC: Total leukocyte count, IgE: Immunoglobulin E

- Distribution of immunoglobulin E levels among severities of eosinophilia.
Parasitic infestations were found to be the most common identified cause of eosinophilia [Table 4]. Even when the causes were analyzed in groups of eosinophilia, parasites were still the most common cause. All the allergic disorders were distributed among mild and moderate eosinophilia. Idiopathic eosinophilia was mostly distributed among severe cases, followed by moderate cases, both of which were classified as idiopathic HE [Figure 2].
| Etiology | Number of patients (%) | Sub-type |
|---|---|---|
| Parasitic infestations | 37 (35) | Identified organisms include: Filaria (n=22), Giardia(n=4), Endolimax nana(n=3), Ancylostoma(n=3), Entamoeba histolytica(n=3), Ascaris(n=2), coccidian parasites (n=1), and Strongyloides(n=1) |
| Allergic disorders | 31 (29.3) | Identified disorders include bronchial asthma (n=8), allergic dermatitis (n=8), allergic bronchopulmonary aspergillosis (n=8). The most common offending allergen were mites, followed by dermatophagoides, animal fur, and Bermuda grass. |
| Autoimmune disease | 7 (6.6) | Scleroderma (n=1), SLE, IgG4 related disease (n=2) |
| Malignancy | 1 (0.9) | Small cell lymphoma |
| Drug associated | 7 (6.6) | |
| Kimura disease | 1 (0.9) | |
| Idiopathic | 14 (13.2) | Seven patients were found to have Entamoeba coli* |
| Incomplete evaluation | 9 (8.5) |
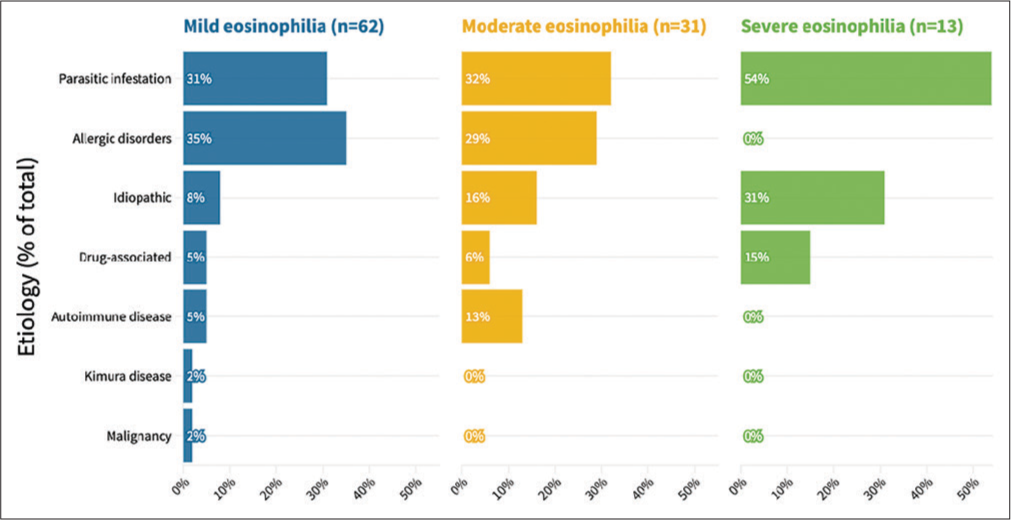
- Comparison of the group of etiology among severities of eosinophilia. The overall comparison was significantly different between the groups (P = 0.046, Fischer’s exact test).
When organ involvement was accessed on patients with persistent eosinophilia, the most common organ involvement was lungs in the form of obstructive/restrictive pattern on pulmonary function test (PFT) [Table 5]. When analyzed with AEC, end-organ involvement had no direct association with the increase in AEC, nor was varied significantly among the three severity groups of eosinophilias (P = 0.07) [Table 6].
| Organ/organ system | Frequency of occurrence n(%) |
|---|---|
| Lungs | 14 (13.2) |
| Skin | 5 (4.7) |
| Kidney | 1 (0.9) |
| Oral and maxillofacial area | 1 (0.9) |
| Categories of eosinophilia | Frequency of patients with end-organ involvement n(%) | Frequency of patients with no end-organ involvement n(%) |
|---|---|---|
| Mild eosinophilia | 8 (12.9) | 54 (87.1) |
| Moderate eosinophilia | 10 (32.26) | 21 (67.74) |
| Severe eosinophilia | 3 (23.08) | 10 (76.92) |
| Total | 21 (19.81) | 85 (80.19) |
DISCUSSION
Our study found that eosinophilia commonly occurred in the third decade (mean ± SD, 35.44 ± 1.35 years). Overall, it was almost slightly more common in males (56%) with a female preponderance in the group with severe eosinophilia. Similar findings have been seen in the previous studies from India.[15] However, studies in developed nations have shown eosinophilia to be more common in the fifth and sixth decades and have a female preponderance.[16,17] The younger age group of presentation of the disease in India may be due to the relatively early presentation of parasitic infections, allergic disorders, and autoimmune disorders which contributed to the majority of cases.
In our study, as in the previous studies from developing nations, the most common cause overall and in each category of eosinophilia was parasitic infestations.[2,15,18,19] This is linked to both the socioeconomic status of the region and the higher diagnostic accuracy with strict emphasis placed on three consecutive stool samples and four simultaneous methods on samples to detect filarial larvae. In a study from north India, parasites were the most common cause (16%), followed by bronchial asthma and allergic rhinitis (6%).[19] In our study as well, the second most common etiology was allergic disorders. Malignancy-associated eosinophilia was rare in our population compared to previous populations; this may be attributed to our small sample size.[16]
Patients with eosinophilia present most commonly with constitutional symptoms such as fever, cough, and dyspnea. Specific symptoms such as rashes and itching may be seen in some patients, while others may present with non-specific symptoms like abdominal pain.[15,16,18] This was similar to our findings, where cough, generalized weakness, and fever were the most common complaints. The presence of wheeze or rhonchi was the most common clinical finding in our study, which may be explained by underlying asthma or ABPA in these cases.[16,20,21]
The median IgE level in our study was 1014 ± 1983.2. When the stratified analysis was done with respect to eosinophil counts, there was no significant association between IgE level and AEC. There was a set of patients with IgE within the normal range also. This suggests an alternate pathway in clonal proliferation and distribution of eosinophils apart from IgE mediated.
Elevated IgE levels were found to be associated with a diagnosis of allergic disorders. This is similar to the previous literature, where allergic disorders and asthma are strongly associated with elevated IgE levels.[22]
In our study, the most commonly affected organs were the lungs, followed by skin, while other sites of damage such as kidneys and mass lesions were relatively rare. The previous studies have demonstrated abnormal PFTs, chest X-rays, and CT scans in patients with eosinophilia, indicating significant pulmonary involvement.[16,18-21] We found no significant level of prediction between end-organ involvement and degree of eosinophilia. This highlights the importance of working up symptomatic patients for end-organ damage irrespective of the eosinophil count.[23]
The previous studies had also shown a high incidence of thromboembolism (~8%) in patients of eosinophilia, which was relatively rare in our population.[16] This may be due to mainly in-hospital recruitment in the previous studies where patients may have presented with the complaint of thromboembolism.
Our study provides insight into common etiologies of eosinophilia in India. Since a complete workup for eosinophilia was done in almost all of the patients, our findings can be reported with confidence. Only 13.2% of cases in our population were idiopathic, compared to previous estimates of nearly one-third. This indicates that our panel of testing was more comprehensive than in the previous studies. After the review of the literature, it was found that there are no recent data from North India on etiologies of eosinophilia. Furthermore, there is no recent data on the correlation of eosinophilia with organ system involvement in North India.
Our study had a few limitations. Since this was a single-center study with a small sample size of about 100 patients, the generalizability of the findings may be limited. Due to a cross-sectional design, further clinical courses of the patients could not be determined. Patients with primary eosinophilic disorders were referred and managed at the Hematology and Medical Oncology services and were thus underrepresented in our study. Longitudinal studies with larger sample sizes may shed light on the same. A correlation with organ system involvement is limited by the small sample size.
CONCLUSION
Eosinophilia is a commonly encountered abnormality in clinical practice. In our population, parasitic infestations are the most common cause of eosinophilia, followed by allergic disorders. The symptomatology of eosinophilia includes constitutional symptoms, cough, itching, and rashes. IgE levels correlate with a diagnosis of atopy or asthma and do not show a correlation with AEC. The lungs are the most frequently damaged organ, followed by the skin. There is no correlation between end-organ damage and the degree of eosinophilia, and thus, even patients with mild eosinophilia should be evaluated for evidence of end-organ damage.
Acknowledgment
We would like to acknowledge the contribution of laboratory staff in running the investigations and obtaining diagnoses.
Declaration of patient consent
The authors certify that they have obtained all appropriate patient consent.
Conflicts of interest
There are no conflicts of interest.
Financial support and sponsorship
Nil.
References
- World Health Organization-defined eosinophilic disorders: 2017 update on diagnosis, risk stratification, and management. Am J Hematol. 2017;92:1243-59.
- [CrossRef] [PubMed] [Google Scholar]
- Eosinophilic disorders: Evaluation of current classification and diagnostic criteria, proposal of a practical diagnostic algorithm. Clin Transl Allergy. 2019;9:36.
- [CrossRef] [PubMed] [Google Scholar]
- (A Critical Appraisal of) classification of hypereosinophilic disorders. Front Med (Lausanne). 2017;4:216.
- [CrossRef] [PubMed] [Google Scholar]
- Pocket Guide for Asthma Management and Prevention. 2020. Available from: https://ginasthma.org/wp-content/uploads/2020/04/Main-pocket-guide_2020_04_03-final-wms.pdf [Last accessed on 2021 Aug 19]
- [Google Scholar]
- Allergic aspergillosis of the respiratory tract. Eur Respir Rev. 2014;23:8-29.
- [CrossRef] [PubMed] [Google Scholar]
- The 2019 American College of Rheumatology/ European league against rheumatism classification criteria for IgG4-related disease. Arthritis Rheumatol. 2020;72:7-19.
- [CrossRef] [PubMed] [Google Scholar]
- Allergic Rhinitis and its Impact on Asthma (ARIA) guidelines: 2010 revision. J Allergy Clin Immunol. 2010;126:466-76.
- [CrossRef] [PubMed] [Google Scholar]
- Atopic dermatitis: Natural history, diagnosis, and treatment. ISRN Allergy. 2014;2014:354250.
- [CrossRef] [PubMed] [Google Scholar]
- Drug reaction with eosinophilia and systemic symptoms (DRESS) syndrome. J Clin Aesthet Dermatol. 2013;6:31-7.
- [Google Scholar]
- Kimura disease: Case report and brief review of literature. Med Pharm Rep. 2019;92:195-9.
- [CrossRef] [PubMed] [Google Scholar]
- Drug-induced eosinophilic lung disease. Clin Chest Med. 2004;25:77-88.
- [CrossRef] [PubMed] [Google Scholar]
- Practical guidance for clinical microbiology laboratories: Laboratory diagnosis of parasites from the gastrointestinal tract. Clin Microbiol Rev. 2018;31:e00025-17.
- [CrossRef] [PubMed] [Google Scholar]
- Filariasis: Diagnosis and treatment. Dermatol Ther. 2009;22:475-90.
- [CrossRef] [PubMed] [Google Scholar]
- Phadiatop-a novel IgE antibody screening test. Clin Allergy. 1987;17:409-16.
- [CrossRef] [PubMed] [Google Scholar]
- Incidence of Eosinophilia in rural population in North India: A study at tertiary care hospital. Ann Pathol Lab Med. 2017;4:A43-7.
- [CrossRef] [Google Scholar]
- Eosinophilia: A study of 100 hospitalized patients. Eur J Intern Med. 2007;18:196-201.
- [CrossRef] [PubMed] [Google Scholar]
- Marked and persistent eosinophilia in the absence of clinical manifestations. J Allergy Clin Immunol. 2014;133:1195-202.
- [CrossRef] [PubMed] [Google Scholar]
- The spectrum of hypereosinophilia and associated clonal disorders-a real-world data based on combined retrospective and prospective analysis from a tropical setting. Mediterr J Hematol Infect Dis. 2018;10:e2018052.
- [CrossRef] [PubMed] [Google Scholar]
- A study of clinical profile and spontaneous course of eosinophilia. JK Sci J Med Educ Res. 2005;7:3.
- [Google Scholar]
- Spectrum of eosinophilic end-organ manifestations. Immunol Allergy Clin North Am. 2015;35:403-11.
- [CrossRef] [PubMed] [Google Scholar]
- Recent advances in pathogenesis and management of hypereosinophilic syndromes. Allergy. 2004;59:673-89.
- [CrossRef] [PubMed] [Google Scholar]
- The role of immunoglobulin E in allergy and asthma. Am J Respir Crit Care Med. 2001;164:S1-5.
- [CrossRef] [PubMed] [Google Scholar]
- Hypereosinophila with multi-organ dysfunction-a diagnostic conundrum. J Assoc Physicians India. 2018;66:80-3.
- [Google Scholar]