Translate this page into:
Predicting COVID-19 pneumonia severity on chest X-ray with convolutional neural network: A retrospective study

*Corresponding author: Vishal Rao, Department of Head and Neck Surgical Oncology, HCG Cancer Hospital, Bengaluru, Karnataka, India. hnresearch@hcgel.com
-
Received: ,
Accepted: ,
How to cite this article: Rao V, Priyanka MS, Lakshmi A, Faheema AG, Thomas A, Medappa K, et al. Predicting COVID-19 pneumonia severity on chest X-ray with convolutional neural network: A retrospective study. Indian J Med Sci 2020;132:40.
Abstract
Objectives:
Radiological lung changes in COVID-19 infections present a noteworthy avenue to develop chest X-ray (CXR) -based testing models to support existing rapid detection techniques. The purpose of this study is to evaluate the accuracy of artificial intelligence (AI) -based screening model employing deep convolutional neural network for lung involvement.
Material and Methods:
An AI-based screening model was developed with state-of-the-art neural networks using Indian data sets from COVID-19 positive patients by authors of CAIR, DRDO, in collaboration with the other authors. Our dataset was comprised of 1324 COVID-19, 1108 Normal, and 1344 Pneumonia CXR images. Transfer learning was carried out on Indian dataset using popular deep neural networks, which includes DenseNet, ResNet50, and ResNet18 network architectures to classify CXRs into three categories. The model was retrospectively used to test CXRs from reverse transcriptase-polymerase chain reaction (RT-PCR) proven COVID-19 patients to test positive predictive value and accuracy.
Results:
A total of 460 RT-PCR positive hospitalized patients CXRs in various stages of disease involvement were retrospectively analyzed. There were 248 males (53.92%) and 212 females (46.08%) in the cohort, with a mean age of 50.1 years (range 12–89 years). The commonly observed alterations included lung consolidations, ground-glass opacities, and reticular–nodular opacities. Bilateral involvement was more common compared to unilateral involvement. Of the 460 CXRs analyzed, the model reported 445 CXRs as COVID -19 with an accuracy of 96.73%.
Conclusion:
Our model, based on a two-level classification decision fusion and output information computation, makes it a robust, accurate and reproducible tool. Based on the initial promising results, our application can be used for mass screening.
Keywords
Chest X-ray
Classification
Transfer learning
Output information

INTRODUCTION
Early diagnosis of patients with COVID-19 is of paramount importance as it helps in formulating effective isolation strategies and reducing infectivity. Early diagnosis also enables health care professionals and government authorities to break the chain of transition and flatten the epidemic curve.[1]
One of the key components in the fight against COVID-19 is the employment of effective and reliable screening methods. For detection of COVID-19 infection, the main screening method used is reverse transcriptase-polymerase chain reaction (RT-PCR) testing. The RT-PCR detects SARSCoV-2 RNA from respiratory specimens. RT-PCR testing is a highly specific, laborious, time-consuming, and complicated manual process for sample collection.[2]
Patterns of COVID-19 lung disease can be identified on conventional chest radiography as well as chest computed tomography (CT). Early studies indicate that a patient with COVID-19 infection shows abnormalities in chest radiography image, and attempts have been made to employ it as a primary tool for COVID-19 screening.[3,4]
Typical findings when reporting both confirmed and suspected COVID-19 patients on Chest X-ray (CXR) include terms such as irregular, patchy, hazy, reticular, and widespread ground glass.[4,5] Grading disease severity based on total lung involvement is also important for the clinicians toward making informed decisions regarding patient treatment.
Recent deep learning developments have led to phenomenal success in the field of computer vision, especially in the area of object detection and recognition, scene understanding, scene segmentation, and simultaneous localization and mapping for self-driving cars. Deep learning has been successfully applied on medical images for problems such as skin cancer detection, brain disease classification, and pneumonia detection from CXR images. One of the biggest advantages of the deep convolutional network is automatic feature engineering.[6] In the current study, we evaluated the accuracy and reliability of an Indigenous Deep Learning Application for COVID-19 screening using digital CXRs.
MATERIAL AND METHODS
This was a non-randomized, single-center retrospective study approved by the institutional review board. This validation study included individual data from patients undergoing treatment for RT-PCR positive on nasopharyngeal–throat swab tested at COVID hospitals between June 2020 and July 2020. All these patients underwent the standard set of baseline investigations, namely complete blood count, C-reactive protein, ESR, liver and muscle enzymes levels, renal function tests, and CXR as per healthcare regulations.
An artificial intelligence (AI) -based screening model was developed by employing state-of-the-art neural networks based on Indian data sets from COVID-19 positive patients. Our dataset comprised of 1324 COVID-19, 1108 Normal, and 1344 Pneumonia CXR images. Transfer learning was carried out on Indian dataset using popular deep neural networks, which includes DenseNet, ResNet50, and ResNet18 network architectures to classify the CXRs into three categories. As our dataset was small, we used ResNet18 with regularization to avoid over-fitting. We utilized SVM classification to reduce the false positives and capture the best of both classifiers with SVM based and Softmax classification fusion on features tapped from the last layer of Resnet-18.
Consenting patients aged between 12 and 89 years with differing levels of disease severity were recruited for the study. CXR was performed at the time of admission. Clinical data were captured and duration of symptoms at the time of admission (fever, cough, dyspnea, respiratory distress, diarrhea, and myalgia) was duly recorded.
The model was trained to recognize subtle COVID-19 positive changes in CXR to predict the likelihood of COVID-19 infection. The AI model generated scores based on three parameters, normal, COVID, and pneumonia, with the combined score adding up to 100. Cutoff score for each parameter was set at 60. A score of above 60 as normal was considered false negative and a score below 60 as normal was considered as COVID early stage. A COVID-19 score of more than 60 was assigned as “COVID early stage.” A pneumonia parameter score of more than 60 or a negative normal score of less than 30 was considered as advanced stage pneumonia or ARDS [Figure 1a-c].
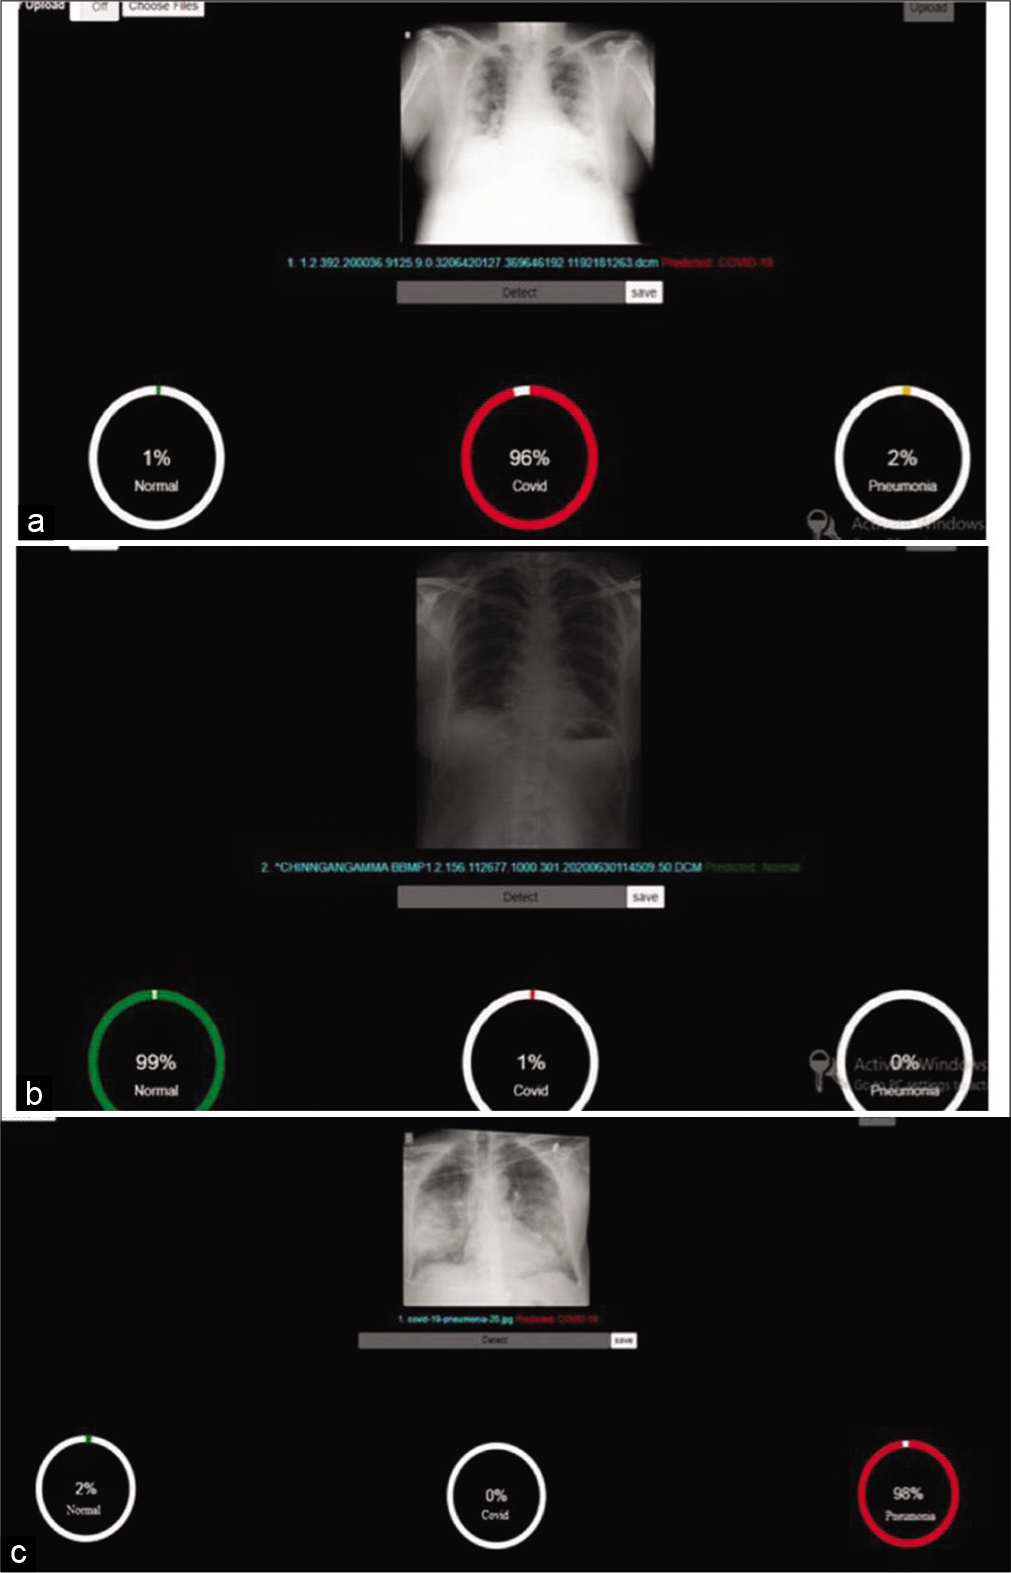
- (a) Predictive analyses for normal. (b) Predictive analysis for COVID. (c) Predictive analysis for pneumonia.
Statistical analysis
Sample size was calculated with 95% confidence level and margin of error of ±7% reference. All characteristics were summarized descriptively. All characteristics were summarized descriptively. For continuous variables, the summary statistics of mean ± standard deviation (SD) were used. For categorical data, the number and percentage were used in the data summaries and diagrammatic presentation. If the p-value was < 0.05, then the results were considered statistically significant, else it was considered statistically insignificant. Data were analyzed using SPSS software v.23 (IBM Statistics, Chicago, USA).
RESULTS
A total of 460 RT-PCR positive COVID-19 patients were recruited for the validation of the application. There were 248 males and 212 females with a male-female ratio of 1.17 [Figure 2]. The mean age of the study population was 50.1 years (12–89 years) [Figures 3a-c and 4]. The age distribution was normal, with 75 percentile over 65 years of age [Figures 5-7a and b].
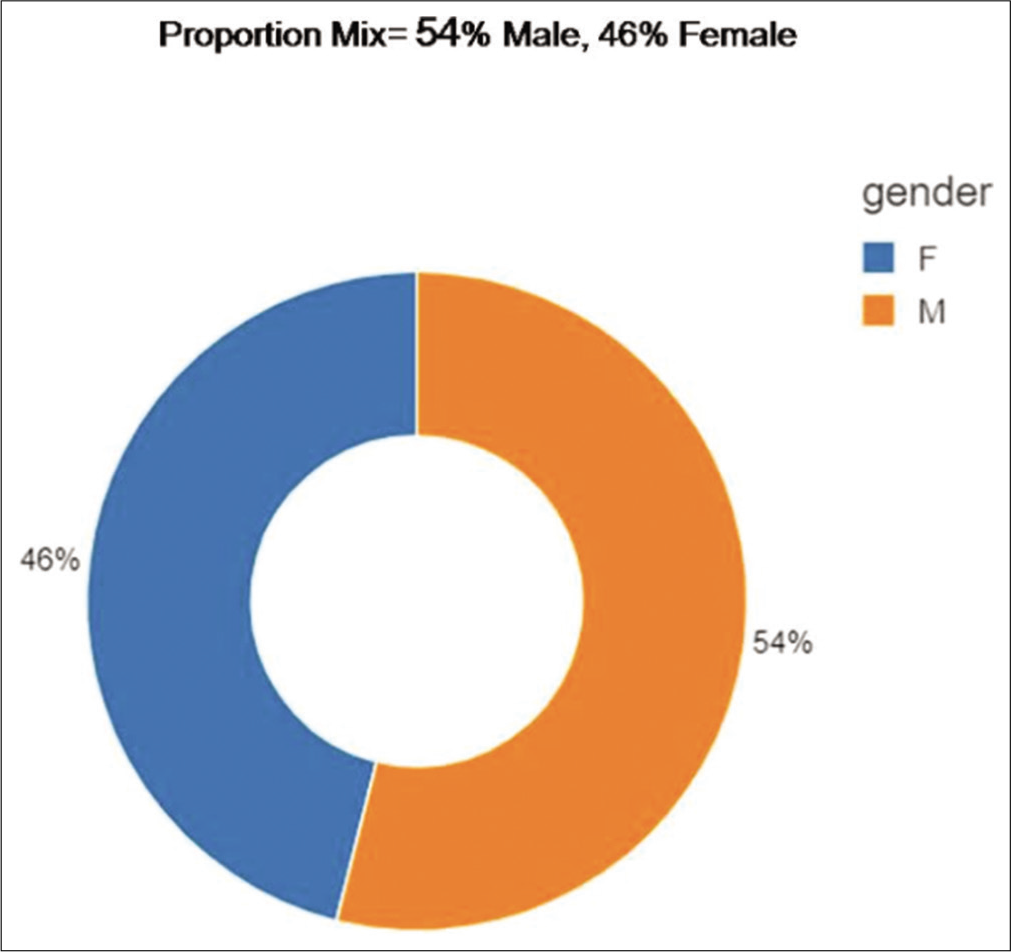
- Sex distribution.
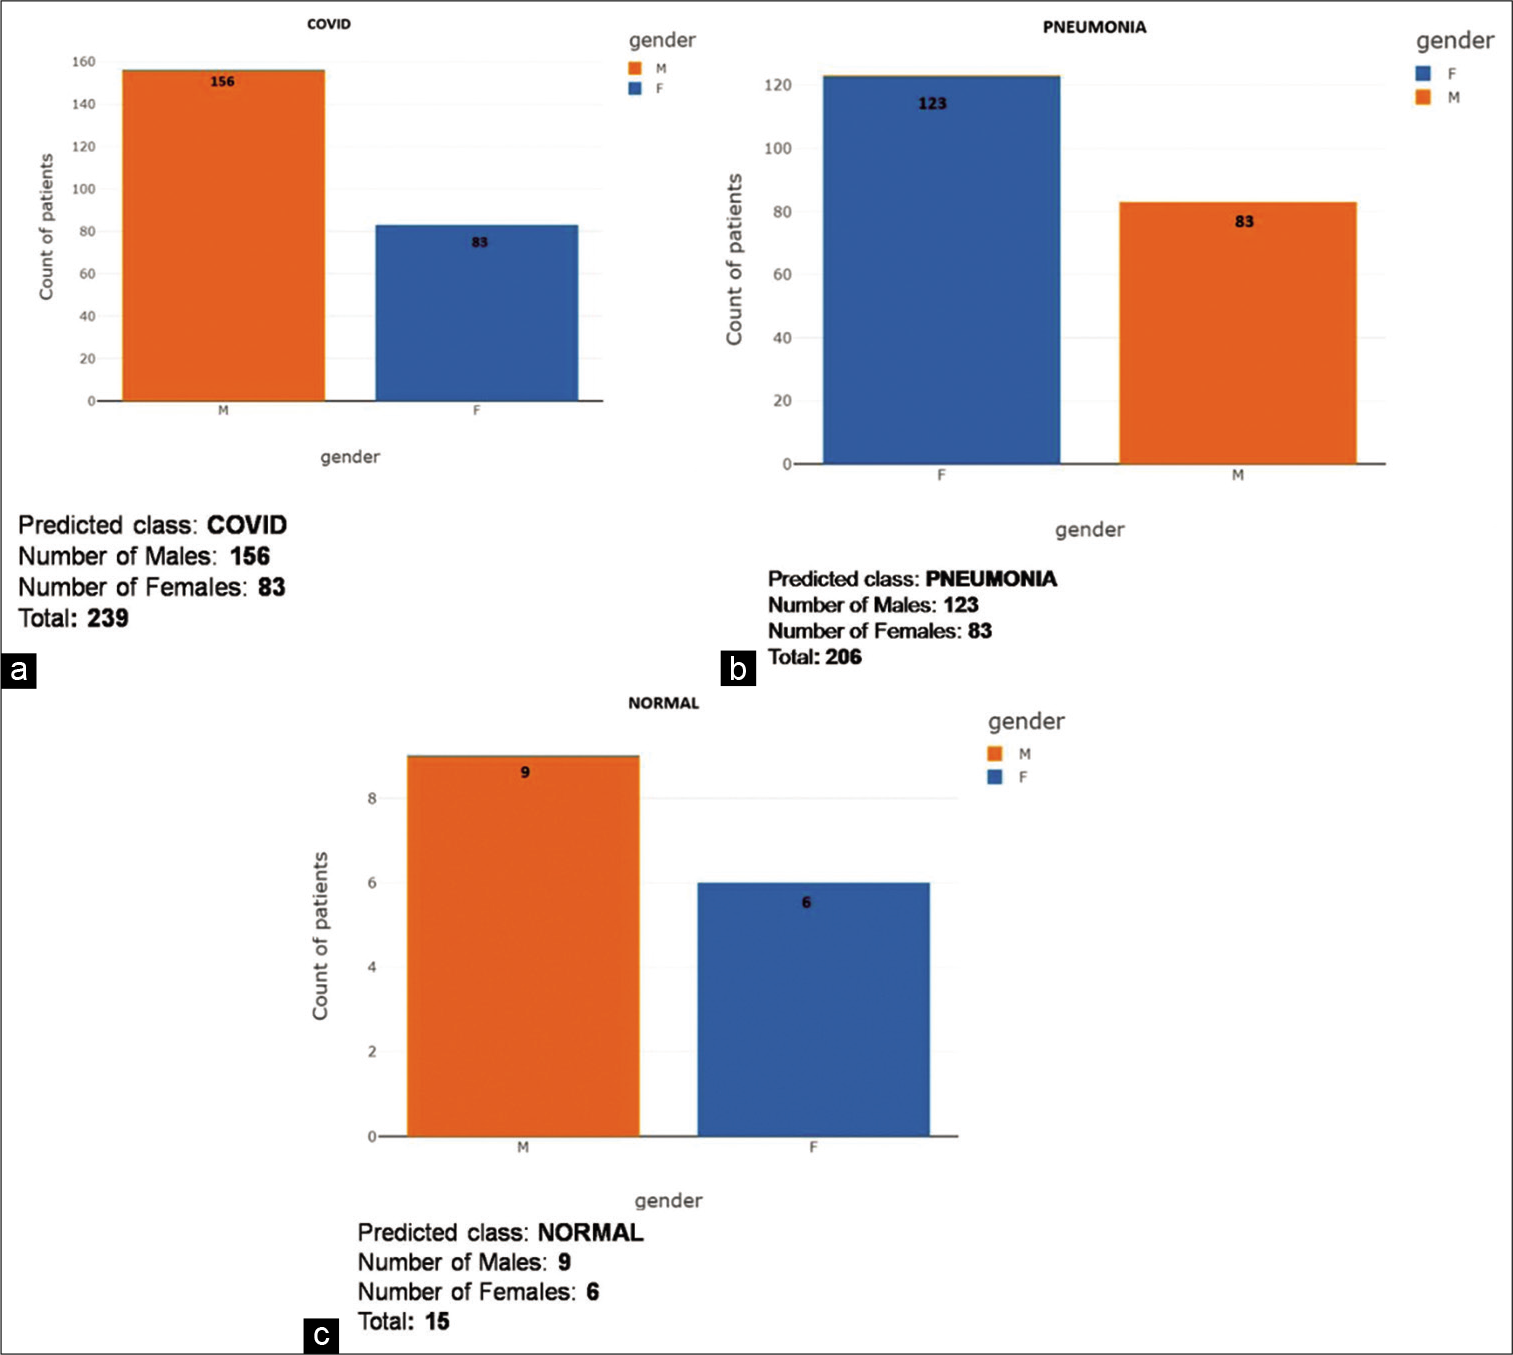
- (a) COVID gender-wise score distribution for predictive analysis. (b) Pneumonia gender-wise score distribution for predictive analysis. (c) Gender-wise score distribution for predictive analysis.
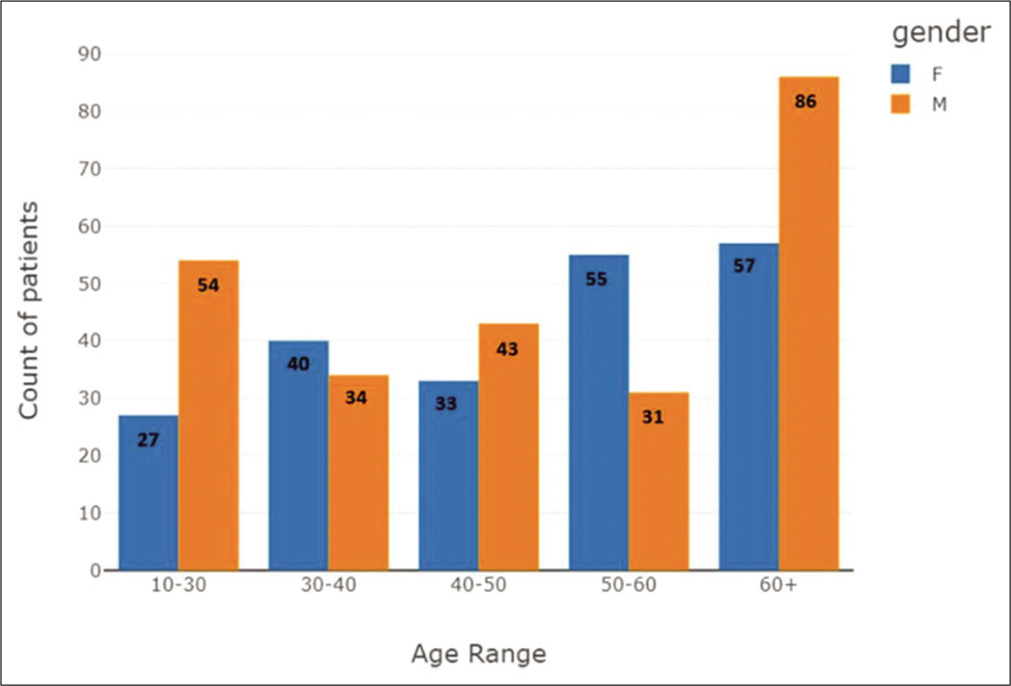
- Age group distribution plot, categorized based on gender.

- Age group distribution plot.
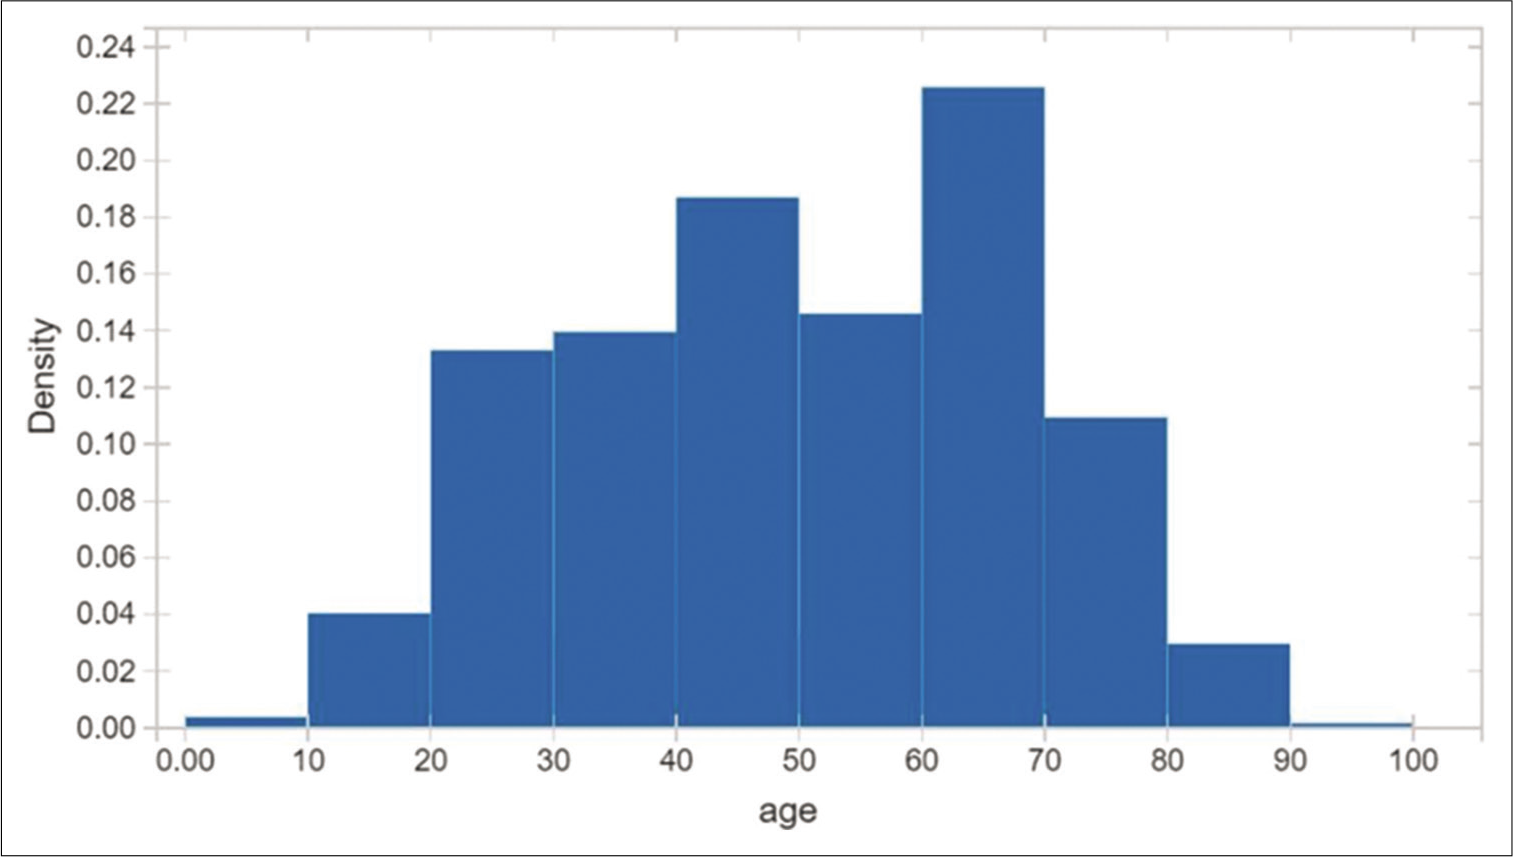
- Age distribution is fairly normal, 75 percentile over 65 years old.

- (a) Age distribution plot – for all predicted classes. (b) Age distribution plot – for all predicted classes.
Of the total 460 patients included in the study, we grouped them into three broad clinical categories. The first group consisted of 67 hospitalized patients who remained asymptomatic during the entire course. They were admitted only as primary contacts of confirmed cases.
There were 266 patients who showed mild to moderate symptoms ranging from cough of varying grades, low grade to high-grade fever, sore throat, myalgia, rhinorrhea, vomiting, fatigue, diarrhea, nasal congestion, conjunctivitis, macular rash, abdominal pain of varying grades, headaches, otalgia, and other minor symptoms. These patients did not require supplemental oxygen and had an improved outcome. The average days of symptoms were around 6 days, with a lower range of 3 and higher range of 11 days.
One hundred twenty-seven patients were graded as severely symptomatic. In addition to worsening of the abovementioned symptoms, they were admitted to the hospital with dyspnea of varying grades, persistent high-grade fever lasting for more than 3 days, disturbance in mental alertness, altered consciousness, stroke-like illness, and other severe symptoms. They required supplemental oxygen in the form of high flow cannula devices, invasive, and noninvasive ventilation. The average days of hospitalization were around 16 days, with a lower range of 9 and higher range of 25 days. The outcome comprised 56 deaths and 71 recoveries.
There were 334 patients with existing comorbidities which included cardiovascular diseases such as previous MI, TIA, hypertension on treatment, CCF, stroke, Type 1 and 2 diabetes mellitus, chronic obstructive pulmonary diseases, chronic kidney disease, malignancies, and obesity.
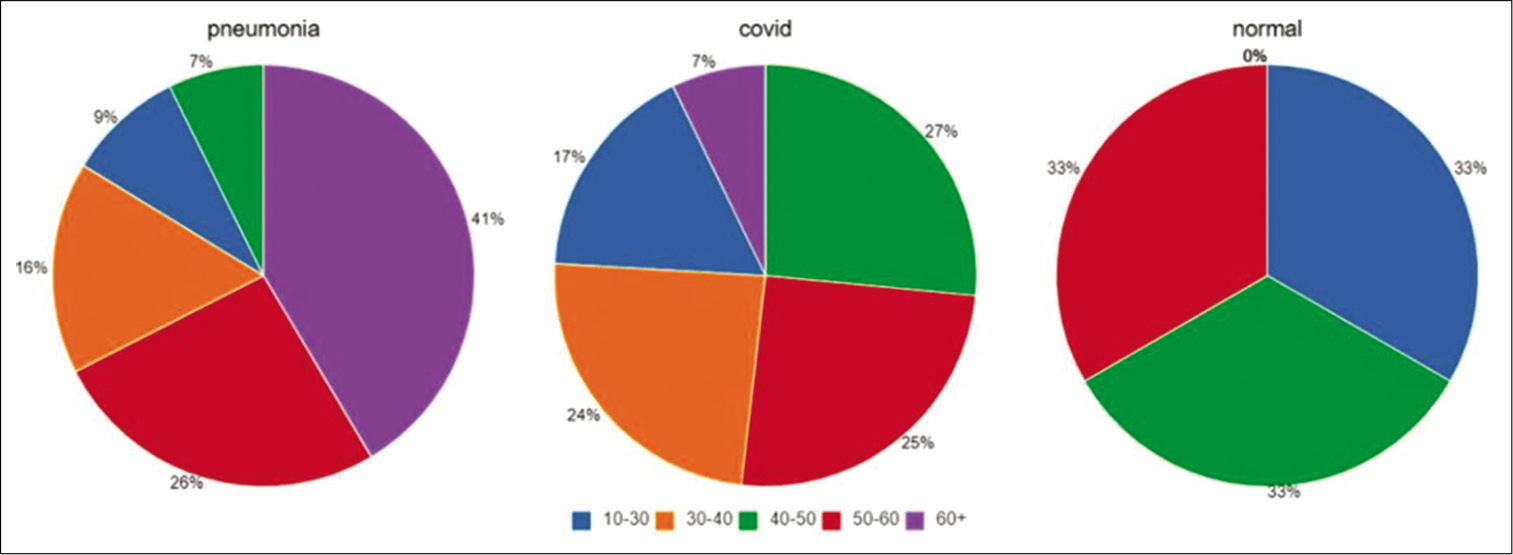
A total of 460 digital CXRs were available for analysis. Results were classified into five age groups and sexes [Figures 7a and b-9].

- Male analysis of age distribution for all predictive classes.
- Female analysis of age distribution for all predictive classes.
Age 10–30 had, a total of 7 false-negative reports, 5 males (71.42%) and 2 females (28.57%); COVID-19 had 41 males (74.54%) and 14 females (25.46%) and advanced stage pneumonia had 8 male (42.1%) and 11 females (57.9 %). Total CXRs analyzed were 81 and 74 (91.35%) X-rays were detected as COVID findings
Age 30–40 had 0 false-negative reports; COVID-19 had 31 males (60.78%) and 20 females (39.21%) and advanced stage pneumonia had 3 males (13.04%) and 20 females (86.96%). Total CXRs analyzed were 74 and all 74 (100 %) X-rays were detected as COVID findings
Age 40–50 had 2 false-negative reports, and both were female (100%); COVID-19 had 36 males (62.06%) and 22 females (37.94%) and advanced stage pneumonia had 7 males (47.22%) and 9 females (52.78%). Total CXRs analyzed were 76 and 74 (97.37%) X-rays were detected as COVID findings
Age 50–60 had 2 false-negative reports, and both were female (100%); COVID-19 had 21 males (50 %) and 21 females (50%) and advanced stage pneumonia had 10 males (23.8%) and 32 females (76.2 %). Total CXRs analyzed were 86 and 84 (97.67%) X-rays were detected as COVID findings
Age 60 years and above had 4 false-negative reports, all 4 males (100%); COVID-19 had 27 males (81.82 %) and 6 females (18.18%) and advanced stage pneumonia had 55 males (51.89 %) and 51 females (48.11%). Total CXRs analyzed were 143 and 97.2% X-rays were detected as COVID findings.
We used a predictive analysis model to determine criteria for cutoffs to designate as COVID, pneumonia and normal and segregated them into count of records, mean value of the percentage values of the following columns – COVID, pneumonia, normal, age, SD of the values from the mean, minimum recorded value, first quartile, median, third quartile, and maximum recorded value [Table 1].
| Count | Count of records |
|---|---|
| Mean | Mean value of the percentage values of the following columns – COVID, pneumonia, normal, age |
| Std | Standard deviation of the values from the mean |
| Min | Minimum recorded value |
| 25% | First quartile |
| 50% | Median |
| 75% | Third quartile |
| Max | Maximum recorded value |
Using the cutoff scores suitable for a predictive model, we found that 192 patients (~80%) had a percentage value of “COVID” greater than 60 and 47 patients (~20%) had a percentage value of “COVID” less than 60 and can be accurately used to determine a set value to categorize the X-ray into early-stage disease [Table 2]. For the pneumonia category, 180 patients (~87%) had a percentage value of “Pneumonia” greater than 60 and 26 patients (~13 %) had a percentage value of “Pneumonia” less than 60 and can be accurately set a value to triage severe cases for immediate hospitalization [Table 3]. For the normal category, 14 patients (~93%) had a percentage value of “Normal” greater than 60 and 1 patient (~7%) had a percentage value of “Normal” less than 60 and can be set as a normal score for using to categorize them into the stable category [Table 4].
| Count | COVID | Normal | Pneumonia | Age |
|---|---|---|---|---|
| 239.000000 | 239.000000 | 239.000000 | 239.000000 | |
| Mean | 77.434268 | 15.721004 | 6.844393 | 43.330544 |
| Std | 17.711141 | 12.696373 | 11.013647 | 14.944560 |
| Min | 29.170000 | 0.000000 | 0.000000 | 13.000000 |
| 25% | 65.035000 | 4.355000 | 0.080000 | 31.000000 |
| 50% | 81.510000 | 13.310000 | 1.140000 | 44.000000 |
| 75% | 93.825000 | 23.875000 | 7.125000 | 55.000000 |
| Max | 100.000000 | 55.920000 | 45.250000 | 83.000000 |
| The mean percentage value (COVID column) had a value of ~ 77 | ||||
| 78 patients (~33%) had a percentage value of “COVID” greater than 90 |
||||
| 127 patients (~53%) had a percentage value of “COVID” greater than 80 |
||||
| 158 patients (~66%) had a percentage value of “COVID” greater than 70 |
||||
| 192 patients (~80%) had a percentage value of “COVID” greater than 60 |
||||
| 47 patients (~20%) had a percentage value of “COVID” less than 60 |
||||
| Only 21 patients (~9%) had a percentage value of “COVID” lesser than 50 | ||||
| Count | Pneumonia | COVID | Normal | Age |
|---|---|---|---|---|
| 206.000000 | 206.000000 | 206.000000 | 206.000000 | |
| Mean | 87.866893 | 6.532718 | 5.600194 | 58.150485 |
| Std | 17.269670 | 11.317777 | 9.139815 | 16.486260 |
| Min | 34.140000 | 0.000000 | 0.000000 | 12.000000 |
| 25% | 81.612500 | 0.050000 | 0.090000 | 46.750000 |
| 50% | 96.910000 | 0.590000 | 1.075000 | 62.000000 |
| 75% | 99.835000 | 6.870000 | 6.995000 | 69.000000 |
| Max | 100.000000 | 45.590000 | 43.370000 | 89.000000 |
| The mean percentage value ( pneumonia column) had a value of ~ 88 |
||||
| 78 patients (~66%) had a percentage value of “Pneumonia” greater than 90 | ||||
| 127 patients (~76%) had a percentage value of “Pneumonia” greater than 80 | ||||
| 169 patients (~82%) had a percentage value of “Pneumonia” greater than 70 | ||||
| 180 patients (~87%) had a percentage value of “Pneumonia” greater than 60 | ||||
| 26 patients (~13 %) had a percentage value of “Pneumonia” less than 60 | ||||
| Only 9 patients (~4%) had a percentage value of “Pneumonia” lesser than 50 | ||||
| Count | Normal | COVID | Pneumonia | Age |
|---|---|---|---|---|
| 15.000000 | 15.000000 | 15.000000 | 15.000000 | |
| Mean | 66.281333 | 27.350000 | 6.367333 | 42.600000 |
| Std | 13.451921 | 14.517054 | 6.654907 | 21.138320 |
| Min | 25.750000 | 10.820000 | 0.350000 | 17.000000 |
| 25% | 61.910000 | 20.970000 | 0.720000 | 23.000000 |
| 50% | 65.220000 | 25.290000 | 2.840000 | 44.000000 |
| 75% | 74.190000 | 26.835000 | 12.060000 | 61.500000 |
| Max | 83.810000 | 73.810000 | 20.280000 | 76.000000 |
| The mean percentage value (normal column) had a value of ~ 66 | ||||
| Only 1 ( ~6.66) patient had a percentage value of “Normal” greater than 80 and less than 90 | ||||
| 6 patients (~40%) had a percentage value of “Normal” greater than 70 and less than 80 |
||||
| 7 patients (~47%) had a percentage value of “Normal” greater than 60 and less than 70 |
||||
| 14 patients (~93%) had a percentage value of “Normal” greater than 60 |
||||
| 1 patient (~7 %) had a percentage value of “Normal” less than 60 | ||||
| Only 1 (~6.66) patient had a percentage value of “Normal” lesser than 50 |
||||
DISCUSSION
It is necessary to implement an automatic detection system as a quick alternative diagnosis option to prevent COVID-19 spread among people. Faster interpretation of radiography images motivated the need of AI-based systems based on deep learning, which has shown very promising results in terms of high accuracy in the detection of patients with COVID-19 infection. Most of the researchers have tried to solve the problem using CT images for the detection of COVID-19 infection. In addition to CT images, researchers are also trying detection of COVID-19 using CXR images, and studies have shown good success in early detection of COVID-19 using X-ray images. The author’s Zhang et al. used a dataset consisting of 100 CXRs images from COVID-19 positive patients and developed a ResNet-based model with pre-trained weights from ImageNet and achieved an F1-score of approximately 0.72 for classification of COVID-19 positive cases.[7] Li et al. used the multi-player model COVID MobileXpert on a dataset of around 537 images which were equally divided into Normal, COVID-19 positive and pneumonia samples.[8] The motivation behind their method was to achieve decent accuracy with lightweight networks with the aim to carry out pneumonia detection on mobile devices. Rajaraman et al. utilized a little bigger dataset which comprises 313 COVID-19 positive images from two different sources.[9] U-Net based lung segmentation was used in their method. Different fine-tuned model-based ensembles were implemented and pruned iteratively to reduce the parameters. For Inception-V3, they achieved the best ensemble model with a weighted averaging strategy. The authors achieved F1-score of 0.9841 and 0.99 on COVID-19 positive and normal, respectively. However, their model suffers due to a significant number of parameters, which results in overfitting and they have not shown visualization (heatmap) of features contributing toward classification. Wang and Wong introduced COVID-Net. It was trained on COVID, a dataset with 358 CXRs images from 266 COVID-19 patient cases. Their architecture was first trained on ImageNet and then achieved a best F1-score of 0.9480 for three-class classification.[10] Mangal et al. carried out a similar research study called CovidAID. CovidAID is based on the DenseNet model built upon CheXNet weights. The authors compared their results with COVID-Net on the same test set. Their findings suggest that CovidAID surpassed COVID-Net with a notable margin, 0.9230 F1 score, compared with 0.3591. CovidAID image visualization shows more precise performance compared to previous studies.[11] Consequently, developed models are not adequately robust, mainly due to the insufficient number of images. Recently, Arman et al. carried out another study, and their network is named as COVID-CXNet.[12] COVID-CXNet is also based on the DenseNet model, which is trained on CXR-14 a large publicly available CXRs dataset with 14 different diseases such as pneumonia and edema.[13] COVID-CXNet achieved an F1-score 0.922 with U-Net based lung segmentation. They incorporated Grad-CAM visualization, which enables us in determining whether the classifier has looked at the right features. COVID-CXNet has 420 layers and significant number of parameters.
A more recent study by Yoo et al.[14] investigated the feasibility of using a deep learning-based decision-tree classifier for detecting SARS-CoV2 infection from CXR images. Their proposed model consisted of a classifier system with three-binary decision trees, each of which was trained by deep-learning models to carry out specific stepwise functions that involved classifying CXRs as normal/abnormal and subsequently processing the abnormal X-rays for signs of TB and COVID-19. The ResNet18 model was employed for the initial classifications which reported accuracy of 0.98.[14] This highlighted the efficacy of the ResNet18 model clinically for the screening of abnormality in COVID-19 and suggested its use in pre-screening patients to fast-track decision making before the availability of RT-PCR results.
Our method employs ResNet-18 architecture with two-level classification decision fusion and output information. The output information computation is used for evaluation of the performance of classifiers, which makes the model more accurate and usable for doctors to make informed clinical decisions. In our study, using the Indigenous imaging processing and AI-assisted deep neural networks model, we could detect with an accuracy of 97.91% which was comparable to several other AI-based models.[14] The proposed model can be used for the diagnosis of COVID-19 using X-ray radiographs.
X-ray radiographs are preferable as they are readily accessible and cost-effective as compared to current screening tests. CT images have been used to screen patients with COVID-19,[15] but cost and accessibility limit its widespread use. Apostolopoulos and Mpesiana suggest that deep learning with X-ray imaging may extract significant biomarkers related to the COVID-19 disease, while the best accuracy, sensitivity, and specificity obtained is 96.78%, 98.66%, and 96.46%, respectively.[16] Ozturk et al. reported 95.38% accuracy achieved using ResNet50 and SVM in combination with 50 images.[17] Murphy et al. reported that their AI system performance for detection of COVID-19 was compared with six independent readers and was found to be comparable or even better at high sensitivity operating points. The results show that at a fixed operating point (sensitivity of 75%), the AI system has a PPV of 77% and NPV of 76%. This result is comparable to performance using the consensus of all six readers (PPV = 72%; NPV = 78%).[18]
In addition, the radiation dose delivered with CT scan is high with an added risk as compared to X-ray. Our model has the ability to diagnose COVID-19 within seconds. Based on the initial promising results, our application can be used for mass screening. In the future, we intend to validate our model by incorporating more images. Patients suspected as COVID-19 positive by the model can be directed to advanced centers for confirmation. Patients diagnosed negative by the model can be advised social distancing norms and not be subjected to RT-PCR tests unless found symptomatic, thereby reducing the sampling burden at dedicated healthcare facilities. The basic principle of reducing the cost and optimizing the time and effort to make diagnostics affordable to a larger section of the society is achievable with this innovation and research. Utilizing AI/ML for such automation and better utilization of expensive and scarce resources such as radiologists and CT scanners has been a key focus of our research. These innovations can make quality healthcare affordable to the people at the base of the economic pyramid.
CONCLUSION
As the pandemic progresses, the medical community will frequently rely on CXRs due to their ease of use. Leveraging CXR images has several advantages; they are cost-effective and abundantly available in the modern healthcare system, and radiography examination can be carried out quickly. These results of our study indicate that our deep learning convolutional neural network model has the ability to grade the severity of lung infection secondary to COVID-19 accurately, which may have an impact on triaging patients with early exposure and mild symptoms to early care and treatment, and decision making of nature of care as well as evaluating the efficacy of medications used for the treatment, especially in the ICU. Our model is robust, accurate, and reproducible, which makes it suitable for mass screening. However, we recommend a large-scale analysis to further explore its applications.
Acknowledgment
The authors would like to thank Desiraju Padma, Dr. Subrata Rakshit, and Director CAIR, Dr. U. K. Singh, for their constant motivation and guidance in R and D of AI-based COVID detection software. Their continuous pursuit for a high-performance product led to the success of this project.
We would also like to thank Dr. Shankar Prasad, Medical Director, St. Philomena’s Hospital, Dr. Ataullah Khan, Pulmonologist, Mallige Hospital, Bengaluru, Md Naushad, Al Ameen Medical College and Hospital, Vaishak Harish, BMS College of Engineering, and Dr. Shalini Thakur, HCG Cancer Care, for the assistance and expertise provided.
Ethical committee approval
HCG Cancer Centre, Bengaluru, India.
Declaration of patient consent
Patient’s consent not required as patients identity is not disclosed or compromised.
Financial support and sponsorship
Nil.
Conflicts of interest
Dr. Ashish Gulia is the editor of this journal. He does not have any competing interest.
References
- The 2019-2020 novel Coronavirus (severe acute respiratory syndrome Coronavirus 2) pandemic: A joint American college of academic international medicine-world academic council of emergency medicine multidisciplinary COVID-19 working group consensus paper. J Glob Infect Dis. 2020;12:47-93.
- [CrossRef] [PubMed] [Google Scholar]
- Diagnosing COVID-19: The disease and tools for detection. ACS Nano. 2020;14:3822-35.
- [CrossRef] [PubMed] [Google Scholar]
- Chest X-ray in new Coronavirus disease 2019 (COVID-19) infection: Findings and correlation with clinical outcome. Radiol Med. 2020;125:730-7.
- [CrossRef] [PubMed] [Google Scholar]
- Radiographic findings in 240 patients with COVID-19 pneumonia: Time-dependence after the onset of symptoms. Eur Radiol. 2020;30:6161-9.
- [CrossRef] [PubMed] [Google Scholar]
- Portable chest X-ray in Coronavirus disease-19 (COVID-19): A pictorial review. Clin Imaging. 2020;64:35-42.
- [CrossRef] [PubMed] [Google Scholar]
- Artificial intelligence, machine learning and health systems. J Glob Health. 2018;8:20303.
- [CrossRef] [PubMed] [Google Scholar]
- COVID-19 Screening on Chest X-ray Images Using Deep Learning Based Anomaly Detection. arXiv No 2003.12338.
- [Google Scholar]
- Iteratively Pruned Deep Learning Ensembles for COVID-19 Detection in Chest X-rays. arXiv No 2004.08379.
- [CrossRef] [PubMed] [Google Scholar]
- COVID-Net: A Tailored Deep Convolutional Neural Network Design for Detection of COVID-19 Cases from Chest Radiography Images. arXiv No 2003.09871.
- [CrossRef] [PubMed] [Google Scholar]
- COVID-CXNet: Detecting COVID-19 in Frontal Chest X-ray Images Using Deep Learning. arXiv No 2006.13807.
- [Google Scholar]
- CheXNET: Radiologist-Level Pneumonia Detection on Chest X-rays with Deep Learning. arXiv No 1711.05225.
- [Google Scholar]
- Deep learning-based decision-tree classifier for COVID-19 diagnosis from chest X-ray imaging. Front Med (Lausanne). 2020;7:427.
- [CrossRef] [PubMed] [Google Scholar]
- CT imaging changes of Corona virus disease 2019 (COVID-19): A multi-center study in Southwest China. J Transl Med. 2020;18:154.
- [CrossRef] [PubMed] [Google Scholar]
- COVID-19: Automatic detection from X-ray images utilizing transfer learning with convolutional neural networks. Phys Eng Sci Med. 2020;43:635-40.
- [CrossRef] [PubMed] [Google Scholar]
- Automated detection of COVID-19 cases using deep neural networks with X-ray images. Comput Biol Med. 2020;121:103792.
- [CrossRef] [PubMed] [Google Scholar]
- COVID-19 on chest radiographs: A multireader evaluation of an Artificial Intelligence system. Radiology. 2020;296:E166-72.
- [CrossRef] [PubMed] [Google Scholar]