Translate this page into:
Epidemiology and outcomes of drug-resistant tuberculosis cases notified in a low-resource district in Kerala, India 2017–2021 – A 5-year retrospective analysis
*Corresponding author: Raman Swathy Vaman, ICMR School of Public Health, Indian Council of Medical Research (ICMR) - National Institute of Epidemiology (NIE), Chennai, Tamil Nadu, India. ramanvaathapi@gmail.com
-
Received: ,
Accepted: ,
How to cite this article: Vaman RS, Kalyanasundaram M, Amina TP, Murhekar MV. Epidemiology and outcomes of drug-resistant tuberculosis cases notified in a low-resource district in Kerala, India 2017–2021 – A 5-year retrospective analysis. Indian J Med Sci. doi: 10.25259/IJMS_45_2024
Abstract
Objectives:
Kasaragod district reports the highest drug-resistant tuberculosis (DR-TB) case notification rates in Kerala. We conducted a cross-sectional study in Kasaragod to describe the DR-TB cases notified from January 2017 to December 2021 and to identify the factors associated with unfavorable treatment outcomes in DR-TB patients.
Materials and Methods:
We analyzed the programmatic data from the “Nikshay portal” (a web-based patient management information system for [TB] under the National TB Elimination Program), DR-TB treatment cards, and treatment registers available with the district TB center for all the DR-TB patients notified during the study period. We described the DR-TB cases by year, local self-government area (the local administrative setup), age, gender, income level, and treatment outcomes. We compared sociodemographic, anthropometric, and clinical factors among the DR-TB patients with favorable (cured and treatment completed) and unfavorable (died, lost to follow-up, and treatment failure) treatment outcomes.
Results:
From January 2017 to December 2021, 128 DR-TB cases were notified from Kasaragod. Annual notification rates varied from 1.4 to 3.4/100,000 population with the highest notification in 2019. The proportion of new TB cases notified tested for drug sensitivity rose from 22% in 2017 to 86% in 2021. Seven of 41 local self-government areas had not notified DR-TB cases during 2017–2021. The notification was higher in inter-state border areas and the coastal belt of the district. The notification of DR-TB cases was highest among the 45–59 age group (17/100,000), followed by the 60 above group (11/100,000). Males and those living below the poverty line had higher notification rates. Among the outcomes evaluated 118 DR-TB patients, 89 (75.4%) had favorable outcomes, whereas the remaining 24.6% had unfavorable outcomes (death 18 [15.3%], loss to follow-up 7 [6%], and treatment failure 4 [3.4%]). Age more than 45 years adjusted odds ratio (aOR) 3.1 (95% confidence interval [CI] 1.1–8.8), income category below the poverty line aOR 6 (95% CI 1.2–28.6), admitted at least twice during treatment aOR 9.2 (95% CI 2.8–30.3), and body mass index at diagnosis <18.5 kg/m2 aOR 3 (95% CI 1.1–10.3) were found to be significantly associated with unfavorable treatment outcomes.
Conclusion:
DR-TB notifications have increased in the Kasaragod district from 2017 to 2021, with a high burden among males aged 45 years and above. The favorable treatment outcome is better than the national and state average. Regular monitoring and follow-up of multidrug-resistant patients with low incomes, above 45 years, and underweight may improve the final treatment outcomes.
Keywords
Tuberculosis
Multidrug-resistant tuberculosis
Extensively drug-resistant tuberculosis
Treatment outcome
India

INTRODUCTION
Tuberculosis (TB), caused by the bacillus Mycobacterium tuberculosis, is the second leading infectious disease cause of death after COVID-19 globally, with an estimated 10.6 million cases and 1.6 million deaths in 2021.[1] Drug-resistant TB (DR-TB) is often more challenging to treat, with poorer patient outcomes than drug-sensitive TB. DR-TB patients face high economic and social costs, and only one in three can access quality care globally.[2] Globally, in 2021, 71% of the microbiologically confirmed pulmonary TB patients were tested for at least Rifampicin (Rif) resistance, with 0.45 million drug-resistant cases detected.[2] India contributes 26% of the total TB burden and 27% of Rif resistance globally, with an estimated DR-TB incidence of 0.9/million population.[3] A recent situation analysis conducted in Kasaragod – one of the low-resource settings in Kerala state, India, revealed a higher notification of DR-TB cases, 0.2/million, compared to the state average of 0.1/million population. The district also reports a 3 times higher proportion of DR-TB cases out of total notified TB cases than the state. Hence, it was pertinent to understand the epidemiology and outcomes of DR-TB cases notified in the district. We analyzed the National Tuberculosis Elimination Program (NTEP) data in the Kasaragod district with the objectives of describing the DR-TB cases notified in the Kasaragod district from January 2017 to December 2021 by time, place, person, and by treatment outcomes and to determine the factors associated with unfavorable treatment outcomes in DR-TB patients.
MATERIALS AND METHODS
We conducted programmatic data analysis of NTEP data in the Kasaragod district of Kerala, India. Kasaragod is the northernmost district of Kerala sharing the border with Karnataka state with a population of 1.5 million and three TB treatment units (TU), the decentralized units for programmatic management of TB cases in the district. An analytical cross-sectional study design was used to describe the DR-TB cases notified in the district for 5 years from January 2017 to December 2021 and to determine the factors associated with unfavorable treatment outcomes. We included all the 128 DR-TB patients notified in the Kasaragod district during the period for our analysis.
We extracted data from the “Nikshay portal” (the web-enabled case-based monitoring application for TB patients as part of India’s NTEP), DR-TB treatment cards, and the DRTB registers kept at the district TB center in Kasaragod. The variables on sociodemographic characteristics, anthropometry, DR-TB diagnosis details, clinical features, and outcome were entered into the structured data abstraction form in Epicollect5. We used the standard definitions used by the NTEP program for classifying the treatment outcomes.[4] For comparing the groups, we classified outcomes as favorable treatment outcomes, including cured and treatment completed, and unfavorable treatment outcomes, including treatment failure, loss to follow-up, and death. A pulmonary TB patient with bacteriologically confirmed TB at the beginning of treatment who completed treatment as recommended by the national policy with evidence of bacteriological response (two consecutive cultures negative) and no evidence of treatment failed (treatment regimen needs to be terminated or permanently changed to a new regimen option or treatment strategy) is considered cured. A patient who completed treatment as recommended by the national policy whose outcome does not meet the definition of a cure or whose treatment failed is considered treatment completed. To ensure the data quality, the data were triangulated using the Nikshay portal, DR-TB treatment cards, and DR-TB registers for all the patients. We used “Nikshay ID” as the unique identifier variable during the triangulation process.
The data were analyzed using STATA version 17 (StataCorp. 2021. Stata Statistical Software: Release 17. College Station, TX: StataCorp LLC), and maps were created using QGIS version 3.22.6 (QGIS.org, 2022. QGIS Geographic Information System. QGIS Association. http://www.qgis.org). The burden of DR-TB is expressed as DR-TB notification per 100,000 population and the proportion (%) of DR-TB out of total TB notification in the district. This burden is described by year, local self-government area (the local administrative setup), age, gender, and income level. All DR-TB patients with outcomes evaluated were included in the analytical study. Bivariate odds ratio with 95% confidence intervals (CIs) was estimated to examine the association between risk factors of interest, such as sociodemographic factors, DR-TB type and treatment, comorbidities, and clinical and laboratory features at the time of diagnosis and unfavorable treatment outcomes. We performed multiple logistic regression to determine the independent risk factors of getting unfavorable treatment outcomes. A P < 0.20 in the bivariate analysis, plausible biological association, or evidence of significant association as documented in earlier studies were the criteria for including as covariates to the logistic regression model. CIs of 95% were reported for each odds ratio. All reported P-values are two tailed, and statistical association is considered significant at a P < 0.05.
Ethical clearance was not required as this study was a secondary data analysis of the programmatic data available with the district health system. Permission to utilize the data was obtained from the Director of Health Services, Kerala, The District Medical Officer (Health) Kasaragod, and the District TB Officer, Kasaragod. The entire patient details were coded and anonymized before the analysis.
RESULTS
128 DR-TB patients were notified in the Kasaragod district from 2017 to 2021. Among them, 47 (36.7%) were monoresistant, 75 (58.6%) were multidrug-resistant (MDR), and 6 (4.7%) were extensively drug-resistant (XDR) TB.
Time distribution of DR-TB cases
TB notification shows a decreasing trend in Kasaragod across 2017–2021, and DR-TB notification is increasing with the highest notification rates in 2019. Figure 1 shows the TB and DR-TB notification rates in Kasaragod.
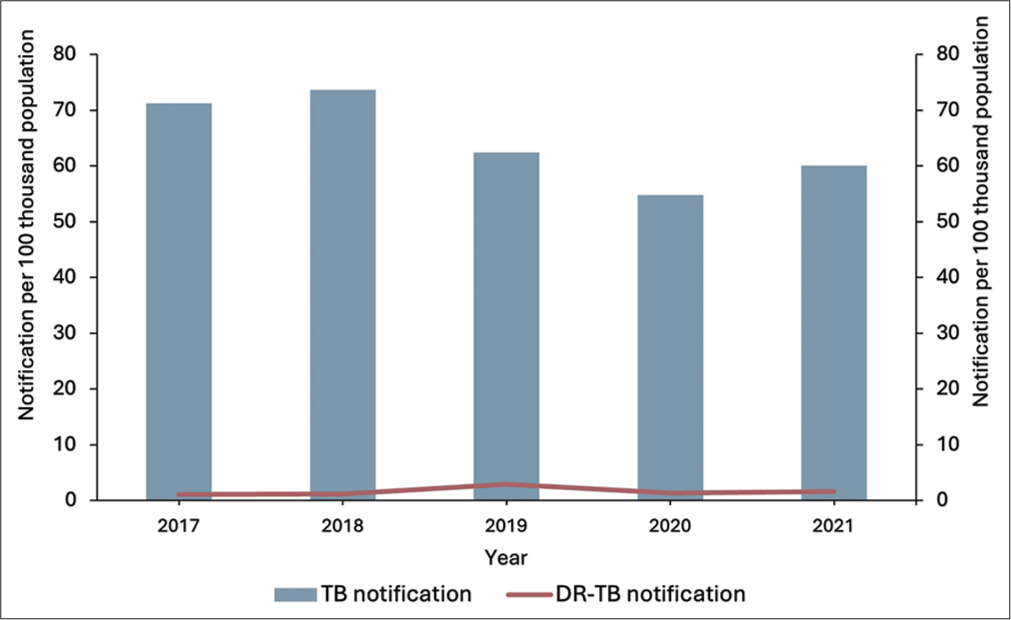
- Tuberculosis (TB) and drug-resistant-TB notification rates of Kasaragod, Kerala, 2017–2021.
The proportion of DR-TB cases out of notified TB cases in Kasaragod increased from 1.8% in 2017 to 3.3% in 2021, with the highest notification of 5.4% in 2019. The proportion of new patients notified rose from 17.6% in 2017 to 61.5% in 2021, and previously treated notifications decreased from 82.4% in 2017 to 38.5% in 2021. Monoresistance cases were first detected in 2018. The proportion of monoresistant patients rose from 10.5% in 2018 to 58% in 2021, and MDR and XDR cases dropped from 88% and 12% in 2017 to 42% and 0% in 2021, respectively.
Place distribution of DR-TB cases
Figure 2 shows the distribution of DR-TB cases by Local Self Government (LSG) area, which is the local administrative units in the state of Kerala. Seven out of 41 LSG units had not notified any DR-TB cases from 2017 to 2021. Across the 5 years, the DR-TB notification per 100,000 population ranged from 0 to 20, and the proportion of DR-TB cases out of total notified TB cases ranged from 0% to 33%. The LSG units nearing the state administrative boundary with the Karnataka state and those adjacent to the coastal belt had higher notifications of DR-TB cases over the years. To understand the DR-TB notification in the context of drug sensitivity testing (DST), we identified the DST rates for the three TB units from 2017 to 2021. Over 5 years, from 2017 to 2021, the DST rate augmented from <30% to 85% across all three TB units.

- Drug-resistant tuberculosis notification by local self-government units, Kasaragod, 2017–2021.
Person distribution of DR-TB cases
The notification of DR-TB was highest (17/100,000 population) among the 45–59 age group, followed by the 60-above group (10.6/100,000 population). No DR-TB cases in the under-five age group were notified in the district. Males had almost 3 times higher notification (12.5 vs. 4.3/100,000 population) than females. Persons living below the poverty line had more than 4 times (16 vs. 3.5/100,000 population) higher notification than those living above the poverty line.
Outcomes of DR-TB patients
All DR-TB patients are clinically followed by the doctor and DR-TB coordinator every month and microbiological and radiological follow-ups were done treatment regimen-wise as per the PMDT guidelines.[4] The year-wise treatment outcomes of DR-TB patients in the Kasaragod district are shown in Table 1. Of the total 118 patients with outcomes evaluated, 89 (75.4%) had favorable outcomes, whereas the remaining 24.6% had unfavorable outcomes (death 18 [15.3%], loss to follow-up seven [6%], and treatment failure four [3.4%]). Among the seven persons who were lost to follow-up, five (71%) were guest workers from other states who left the district without any information and two (29%) persons stopped the treatment as they were unable to tolerate the therapy.
| Year | DR-TB cases | Cured n(%) | Treatment completed n(%) | Died n(%) | Loss to follow-up n(%) | Not evaluated n(%) | Treatment failure n(%) |
|---|---|---|---|---|---|---|---|
| 2017 | 17 | 13 (76.5) | 0 | 3 (17.6) | 1 (5.9) | 0 | 0 |
| 2018 | 19 | 11 (57.9) | 1 (5.2) | 5 (26.3) | 2 (10.5) | 0 | 0 |
| 2019 | 45 | 26 (57.8) | 9 (20) | 4 (8.9) | 2 (4.4) | 2 (4.4) | 2 (4.4) |
| 2020 | 21 | 10 (47.6) | 4 (19%) | 3 (14.3) | 1 (4.7) | 2 (9.5) | 1 (4.7) |
| 2021 | 26 | 13 (50) | 2 (7.7) | 3 (11.5) | 1 (3.8) | 6 (23) | 1 (3.8) |
| Overall | 128 | 73 (57) | 16 (12.5) | 18 (14.1) | 7 (5.5) | 10 (7.8) | 4 (3.1) |
DR-TB: Drug-resistant tuberculosis
Risk factors for unfavorable treatment outcomes
The mean age (standard deviation) of the participants was 44 (16) years and 84 (71%) were males. Forty-four (37.3%) were isoniazid (INH) monoresistant, 68 (57.6%) were MDR, and six (5.1%) were XDR TB. The median duration interquartile range (IQR) between DR-TB diagnosis to initiation of DR-TB therapy was 5 (3 ,12) days. The median duration (IQR) of DR-TB diagnosis to any outcome was 9 (6 ,20) months and 10 (7 ,22) months for cure, and 3 (2 ,14) months for death separately. On comparing the factors, age more than 45 years adjusted odds ratio (aOR) 3.1 (95% CI 1.1–8.8), income category below the poverty line aOR 6 (95% CI 1.2–28.6), admitted at least twice during treatment aOR 9.2 (95% CI 2.8– 30.3), and body mass index (BMI) at diagnosis <18.5 kg/m2 aOR 3 (95% CI 1.1–10.3) were found to be significantly associated with unfavorable treatment outcomes in the multivariate regression model. Table 2 shows the comparison of the factors related to unfavorable treatment outcomes among evaluated DR-TB patients in the Kasaragod district.
| Risk factors | Favorable outcome n (%) | Unfavorable outcome n (%) | cOR (95%CI) | P-value | aOR (95%CI) |
|---|---|---|---|---|---|
| Age (completed years) | |||||
| >45 | 40 (68) | 19 (32) | 2.3 (1–5.6) | 0.058 | 3.1 (1.1–8.8 ) |
| ≤45 | 49 (83) | 10 (17) | Ref | ||
| Gender | |||||
| Female | 23 (67.7) | 11 (32.3) | 1.8 (0.7–4.3) | 0.215 | |
| Male | 66 (78.6) | 18 (21.4) | Ref | ||
| Income category | |||||
| BPL (<25000₹/annum) | 61 (70.1) | 26 (29.9) | 4 (1.1–14.2) | 0.034 | 6 (1.2–28.6) |
| APL (≥25000₹/annum) | 28 (90.3) | 3 (9.7) | Ref | ||
| Mother tongue | |||||
| Others | 17 (77.3) | 5 (22.7) | 0.9 (0.3–2.6) | 0.823 | |
| Malayalam | 72 (75) | 24 (25) | Ref | ||
| Type of TB | |||||
| Extrapulmonary TB | 5 (55.6) | 4 (44.4) | 2.7 (0.7–10.8) | 0.163 | 4.8 (0.8–28.4) |
| Pulmonary TB | 84 (77) | 25 (23) | Ref | ||
| Patient category | |||||
| New | 29 (72.5) | 11 (27.5) | 1.3 (0.5–3) | 0.598 | |
| Previously treated | 60 (77) | 18 (23) | Ref | ||
| Type of drug resistance | |||||
| Multidrug resistance | 53 (71.6) | 21 (28.4) | 1.8 (0.7–4.5) | 0.217 | |
| Mono resistance | 36 (81.8) | 8 (18.2) | Ref | ||
| Default status | |||||
| Defaulted treatment | 6 (54.5) | 5 (45.5) | 2.9 (0.8–10.3) | 0.103 | 2.5 (0.6–10.7) |
| Not defaulted treatment | 83 (77.6) | 24 (22.4) | Ref | ||
| Diabetes Mellitus | |||||
| Yes | 32 (78) | 9 (22) | 0.8 (0.3–2) | 0.629 | |
| No | 57 (74) | 20 (26) | Ref | ||
| Smoking | |||||
| Yes | 36 (78.3) | 10 (21.7) | 0.8 (0.3–1.9) | 0.568 | |
| No | 53 (73.6) | 19 (26.4) | Ref | ||
| Any ADR during treatment | |||||
| Yes | 35 (71.4) | 14 (28.6) | 1.4 (0.6–3.3) | 0.397 | |
| No | 54 (78.3) | 15 (21.7) | Ref | ||
| Admitted at least twice during treatment* | |||||
| Yes | 12 (46.2) | 14 (53.8) | 6 (2.3–15.5) | <0.001 | 9.2 (2.8–30.3) |
| No | 77 (83.7) | 15 (16.3) | Ref | ||
| BMI at diagnosis (kg/m2) | |||||
| <18.5 | 53 (70.7) | 22 (29.3) | 2.1 (0.8–5.5) | 0.078 | 3 (1.1–10.3) |
| ≥18.5 | 36 (83.7) | 7 (16.3) | Ref | ||
| Hb at diagnosis (g/dL) | |||||
| ≤11 | 29 (66) | 15 (34) | 2.2 (0.9–5.2) | 0.067 | 1.2 (0.4–3.4) |
| >11 | 60 (81) | 14 (19) | Ref | ||
DISCUSSION
The notification rates of DR-TB are higher in Kasaragod compared to the state average. TB notifications per 100,000 population in Kasaragod district decreased from 2017 to 2021, and the highest dip in notifications was noted in the year 2020, which can be related to the COVID-19 pandemic, which disrupted the TB diagnostic and treatment services. This notification drop is noted globally, with India contributing 41% of the total reduction in notifications.[2] The DR-TB notification per 100,000 population is higher than the state average of 1.7 and much lower than the national average of 9. The DST rate in Kasaragod is showing a steady increase across the three TUs of the district, reaching more than 90% of the microbiologically confirmed cases, which may be the reason for the increasing DR-TB notification. The higher proportion of DR-TB among notified TB cases in Kasaragod may be due to the lower TB notification, especially from the private sector hospitals bordering the Karnataka state, which does not report to the routine surveillance system. These notification rates suggest that the district may be “missing cases” that need urgent attention. The findings of the National Drug Resistance Survey released in 2018 also estimated that only 44% of the estimated MDR-TB cases were diagnosed in India.[5] Kasaragod district started CBNAAT for Rif resistance for all microbiologically confirmed TB cases from 2017 onward leading to increased DR-TB notifications and primary drug resistance notifications. The line probe assay for INH and Rif resistance was started for all M. tuberculosis cases from 2018 onward, and hence, monoresistance cases are increasing from 2018 to 2021. Due to the Kerala TB elimination mission and the availability of CBNAAT facilities in all districts from 2017, the entire program received a new focus, and notification rates were improving for DR-TB across the state.[6]
From the spatial distribution of the cases across the district, coastal areas and areas sharing boundaries with the Dakshin Kannada district of Karnataka consistently report more DR-TB cases throughout the 5 years. This is consistent with studies conducted in Jodhpur, India, and Ethiopia.[7,8] Further spatio-epidemiological studies are required to explore the clustering of cases in administrative and coastal borders.
The incidence of TB is higher in the 15–45 age group in India.[9] Our study shows the highest notification of DR TB in the 45–59 age group, followed by the above 60 age group. Males and those living below the poverty line have higher DR-TB notifications per previous evidence from India.[7,10,11]
The overall favorable treatment outcome among evaluated cases was 75.4%, and the unfavorable treatment outcome was 24.6%. Several studies across the globe have demonstrated the treatment success rate of DR-TB from 25% to 72 % in various settings.[12-14] The reported mortality for different regimen-wise DR-TB cohorts initiated treatment in 2019 ranged from 5% to 21% and our study reports an overall mortality of 14%.[3]
Our study has identified age of more than 45 years, living below the poverty line, being admitted more than twice during treatment, and BMI at diagnosis in the underweight category as significant predictors for unfavorable treatment outcomes. Many studies conducted in similar settings have identified an age of more than 45 years as a significant predictor for unfavorable treatment outcomes.[15,16] Poor socioeconomic status is a proven risk factor for poor treatment outcomes among TB patients.[17,18] Our study also identified poor economic status as a risk factor for poor outcomes and the existing financial and nutritional support programs, which reached almost 100% of the patients in the district, to be continued. A recent individual participant data meta-analysis has identified that underweight patients had 1.7 times the odds of unfavorable treatment outcomes compared to patients with normal weight.[19] Other studies conducted in India and Vietnam have also identified unfavorable treatment outcomes for underweight patients (BMI <18.5 kg/m2) at diagnosis.[13,20] BMI at diagnosis can be used to predict outcomes, and serial monitoring is needed to identify treatment prognosis.
Limitations
Information bias may be present as we have only used the programmatic data available with the district. We tried to minimize the bias by triangulating the data available with the Nikshay portal, DR TB registers, and treatment cards using the unique “Nikshay ID” as the identifier variable. The factors associated with unfavorable treatment outcomes were not analyzed for individual yearly cohorts and treatment regimen wise, as the number of DR-TB patients was small to explore category and year wise.
CONCLUSION
DR-TB notifications have increased in the Kasaragod district from 2017 to 2021, with a high burden among males aged 45 years and above. The favorable treatment outcome is better than the national and state average. Regular monitoring and follow-up of MDR patients with low incomes, above 45 years, and underweight may improve the final treatment outcomes.
Ethical approval
Institutional Review Board approval is not required.
Declaration of patient consent
The authors certify that they have obtained all appropriate patient consent.
Conflicts of interest
There are no conflicts of interest.
Use of artificial intelligence (AI)-assisted technology for manuscript preparation
The authors confirm that there was no use of artificial intelligence (AI)-assisted technology for assisting in the writing or editing of the manuscript and no images were manipulated using AI.
Financial support and sponsorship
Nil.
References
- Tuberculosis (TB) 2023. Geneva: WHO; Available from: https://www.who.int/news-room/fact-sheets/detail/tuberculosis [Last accessed on 2023 Jun 03]
- [Google Scholar]
- Global tuberculosis report 2022. 2022. Geneva: WHO; Available from: https://www.who.int/teams/global-tuberculosis-programme/tb-reports/global-tuberculosis-report-2022 [Last accessed on 2023 Jun 03]
- [Google Scholar]
- India TB report 2022. New Delhi: Central TB Division; Available from: https://tbcindia.gov.in/index1.php?lang=1&level=1&sublinkid=5613&lid=3658 [Last accessed on 2023 Jun 03]
- [Google Scholar]
- PMDT guidelines. 2021. New Delhi: Central TB Division; Available from: https://tbcindia.gov.in/index1.php?lang=1&level=1&sublinkid=4150&lid=2794 [Last accessed on 2022 May 11]
- [Google Scholar]
- First National Anti-Tuberculosis Drug Resistance Survey (NDRS) from India-an eye opener. J Infectiol Epidemiol. 2018;1:26-9.
- [CrossRef] [Google Scholar]
- Local government stewardship for TB elimination in Kerala, India. Public Health Action. 2023;13:44-50.
- [CrossRef] [PubMed] [Google Scholar]
- Determinants, risk factors and spatial analysis of multi-drug resistant pulmonary tuberculosis in Jodhpur, India. Monaldi Arch Chest Dis. 2022;92:46-54.
- [CrossRef] [PubMed] [Google Scholar]
- Spatial patterns of multidrug resistant tuberculosis and relationships to socio-economic, demographic and household factors in northwest Ethiopia. PLOS One. 2017;12:e0171800.
- [CrossRef] [PubMed] [Google Scholar]
- Prevalence and factors associated with multidrug-resistant tuberculosis in South India. Sci Rep. 2020;10:17552.
- [CrossRef] [PubMed] [Google Scholar]
- Association of risk factors and drug resistance pattern in tuberculosis patients in north India. J Glob Infect Dis. 2017;9:139-45.
- [CrossRef] [PubMed] [Google Scholar]
- Social determinants and risk factors associated with multi-drug resistant tuberculosis among tuberculosis patients in Tamilnadu-a case-control study. Natl J Community Med. 2022;13:771-6.
- [CrossRef] [Google Scholar]
- Treatment outcomes of extensively drug-resistant tuberculosis in Pakistan: A countrywide retrospective record review. Front Pharmacol. 2021;12:640555.
- [CrossRef] [PubMed] [Google Scholar]
- Trends and treatment outcomes of multidrug-resistant tuberculosis in Delhi, India (2009-2014): A retrospective record-based study. Indian J Med Res. 2020;151:598-603.
- [CrossRef] [PubMed] [Google Scholar]
- Treatment outcome of multidrug-resistant tuberculosis with modified DOTS-plus strategy: A 2 years' experience. Lung India. 2019;36:384-92.
- [CrossRef] [PubMed] [Google Scholar]
- Factors associated with unfavorable treatment outcomes in patients with rifampicin-resistant tuberculosis in Colombia 2013-2015: A retrospective cohort study. PLOS One. 2021;16:e0249565.
- [CrossRef] [PubMed] [Google Scholar]
- Factors affecting outcome of longer regimen multidrug-resistant tuberculosis treatment in West Java Indonesia: A retrospective cohort study. PLOS One. 2021;16:e0246284.
- [CrossRef] [PubMed] [Google Scholar]
- Social and health factors associated with unfavourable treatment outcome in adolescents and young adults with tuberculosis in Brazil: A national retrospective cohort study. Lancet Global Health. 2021;9:e1380-90.
- [CrossRef] [PubMed] [Google Scholar]
- Impact of socio-economic factors on Tuberculosis treatment outcomes in north-eastern Uganda: A mixed methods study. BMC Public Health. 2021;21:2167.
- [CrossRef] [PubMed] [Google Scholar]
- Low body mass index at treatment initiation and rifampicin-resistant tuberculosis treatment outcomes: An individual participant data meta-analysis. Clin Infect Dis. 2022;75:2201-10.
- [CrossRef] [PubMed] [Google Scholar]
- Risk factors for poor treatment outcomes of 2266 multidrug-resistant tuberculosis cases in Ho Chi Minh City: A retrospective study. BMC Infect Dis. 2020;20:164.
- [CrossRef] [PubMed] [Google Scholar]