Translate this page into:
Quantitative electroencephalography as a tool for objective neurophysiological seizure diagnosis: A retrospective study
*Corresponding author: Kamlesh Jha, Professor, Department of Physiology, All India Institute of Medical Sciences, Patna, Bihar, India. drkamleshjha@gmail.com
-
Received: ,
Accepted: ,
How to cite this article: Kumar R, Kumar T, Jha K, Kumar Y. Quantitative electroencephalography as a tool for objective neurophysiological seizure diagnosis: A retrospective study. Indian J Med Sci 2021;73(2):212-6.
Abstract
Objectives:
Seizure is the fourth most common neurological disorder in the world; it affects all age groups with equal possibility of occurrence in both males and females. Many antiepileptic drugs are available today, but its diagnosis is challenging. The present study attempted to see if seizure activities could be predicted by analyzing the pre-seizure electrical activities. The prediction may help in taking preventive measures appropriately beforehand in the individuals with seizure proneness.
Material and Methods:
We selected 11 generalized seizure patients and 19 control patients out of total 115 patients referred for electro-diagnostics for various reasons. EEG of the subjects recorded, segmented as per protocol, and analyzed using MATLAB and EEGLAB tools.
Results:
The mean energy level in alpha and beta band of the study subject was significantly lower (P = 0.04 and 0.004, respectively) as compared to the age matched control subjects. Theta and delta bands did not show any significant difference between the groups. The difference between the pre- and post-electrical seizure energy and entropy was statistically insignificant.
Conclusion:
The study shows that the energy level remains low in the seizure patients in the alpha and beta bands. This further goes down when electrophysiological seizure activities starts. The randomness or entropy does not alter significantly among the seizure subjects in comparison to non-seizure subjects.
Keywords
QEEG
Epilepsy
ICA
Alpha waves
Energy
Entropy

INTRODUCTION
Epilepsy is a common neurological disorder worldwide. As per the WHO 60–70 Million people are affected with epilepsy globally (Fergus et al., 2016; Meng et al., 2017).[1,2] Epileptic seizures are dysfunction of brain characterized clinically by localized or generalized convulsion and electrophysiologically by synchronous discharge of a cluster of neurons placed in the cerebral cortex as evidenced by abnormal patterns in the electroencephalography. The recent classification of epileptic seizures based on the International League Against Epilepsy (Berg et al., 2010, Chang et al., 2017)[3,4] classifies seizure disorders into three categories: Focal, generalized, and epileptic spasms. Focal seizures usually originate in one cerebral hemisphere of the brain. Generalized seizures affect both the cerebral hemispheres with seizures originating in the cortex or subcortical area. Generalized seizures could be generalized tonic-clonic, absence, atonic, or myoclonic varieties. A third type of seizure is epileptic spasms which manifest by rapid expansion or flexion of extremity and is usually a feature of childhood epileptic syndromes.
Continuous EEG recording has become an important clinical tool for the assessment and treatment of epilepsy (Gotman, 1989).[5] The quantitative EEG (QEEG) analysis is one of the proven tools for gauging the effects of substances on the central nervous system in the clinical, experimental, and concerned disciplines (Holler et al., 2018).[6] Conventionally, frequency parameters are solely used for diagnosis and prediction of seizure activities. After advent of computer based EEG recording and analytical techniques, a lot of advancements have been made in the field of quantitative EEG analytics. Some of the commonly applied newer techniques of quantitative analytics include representation of frequency through wavelet transforms, independent component analysis (ICA), principal component analysis, and non-linear analytics including coherence analysis source localization (Buhimschi et al., 1998; Leman et al., 1999; Maner et al., 2006, and Diab et al., 2010).[7-10] The energy distribution across various frequency bands has been used recently as one of the sensitive tools for the purpose of seizure detection (Omerhodzic et al., 2010).[11] EEG offers a real-time assessment of temporal dynamics of brain signals during various activation procedures such as photo-stimulation (flashing of light) and hyperventilation. EEG signals consist of five frequency bands, that is, Gamma (30–60 Hz), Beta (13–30 Hz), Alpha (8–13 Hz), Theta (4–8 Hz), and Delta (0.3–4 Hz).
The present work aims to address the possibility of using QEEG as an objective diagnostic tool for possibility of prospective seizure attacks among the susceptible individuals. A study of energy and entropy levels among seizure and control subjects both during interictal/normal periods as well as during the actual electrophysiological seizure activities (as evidenced by the typical EEG discharges diagnostic of seizure activities without clinical presentation) could possibly yield an EEG based marker that could be used for prospective seizure prediction among the susceptible individuals.
MATERIAL AND METHODS
Subject selection
With all due ethical considerations and permissions, the EEG records of the subjects referred to the neurodiagnostic facility of the institute for various reasons during the study period has been retrieved. At every level, it has been ensured that patient identity should not get divulged by any means and the data to be exclusively used for the study purpose. Out of a total 115 subjects referred to the facility for EEG study, 11 patients have qualified as per the inclusion and exclusion criteria. Fifteen healthy normal records who did not had any history of seizure and having no seizure specific findings in the EEG records have been taken as control for comparison.
The inclusion criteria for the case group included age of disease onset to be between 5-15 Yrs., duration of the complaint (Seizure) for at least 1 year, EEG ictal discharges should be generalized and high amplitude. Exclusion criteria included seizure secondary to deep brain stimulation or vagus nerve stimulation or any other specific neurostimulation for epilepsy, cases with focal seizure, cases of known neurological disorders including multiple sclerosis, facial palsy, cerebellar palsy, ADHD, cerebellar ataxia, and Jerky movement, disorders of sleep, history of Drug ediction, smoking, alcohol, etc.
EEG recordings
As per the standard norms of the neurodiagnostic facility of the institute, all recordings were performed during the daytime (9 am–5 pm). EEG recorded using by 21 electrodes with a sampling rate of 256 Hz (RMS EEG-32 Super Spec, India). The EEG signals were collected from Montages of ECG-A2, F4-C4, C4-P4, P4-O2, Fp1-F3, F3-C3, C3-P3, P3-O1, FP2-F8, F8-T4, T4-T6, T6-O2, FP1-F7, F7-T3, T3-T5, and T5-O1 in longitudinal bipolar montages with ground electrode placed at FpZ as per the international 10-20 system of electrode placement. Amplifier of 50 Hz notch filter applied for noise cancellation. Total recording time for all the subjects were 20–25 min as per the standard norms of the lab.
Work plan
Figure 1 shows the flow chart of the work plan for the study.
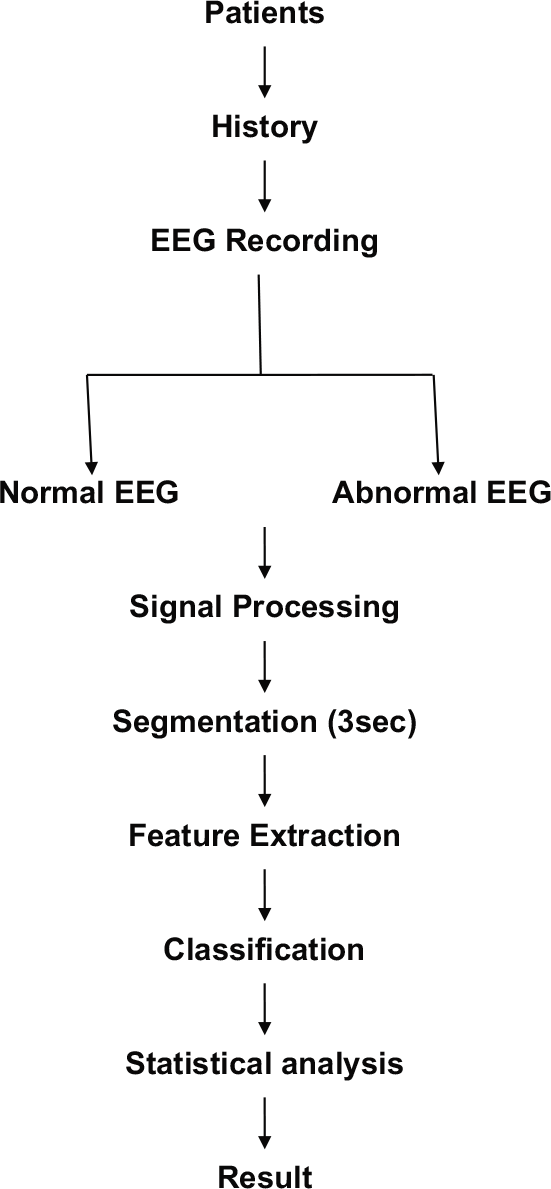
- Flow chart of work plan.
EEG signal analysis
EEG raw signal pre-processing in MATLAB included artifact removal, frequency division, and segmentation. A 50 Hz notch filter has been used to remove interference on the power line from the raw signals. In this study, we have used ICA for the removal of the artifacts and we reconstructed brain waves of alpha, beta, theta, and delta. Usually, two classical wavelet functions are often used to analyze the EEG. One is Daubechies (Db) wavelet and another biorthogonal wavelet; here, we have used Db4 for the waves decomposition (Kalayci and Özdamar, 1995; Petrosian et al., 2000).[12,13]
ICA uses for the rejection of artifacts
ICA has been used to remove artifacts from electroencephalography data. The signals recorded from the scalp were obtained by a mixture of various other signals such as an eye blink and muscle artifacts. ICA is used to filter all the artifacts that may be originating from those bio-signals originating from eye blink and neuromuscular sources. The raw signal, which was allowed to go through ICA, was made to pass through a notch filter to remove the artifacts caused due to interference of 50 Hz line frequency in the EEG dataset. This was followed by a Bandpass filter (band of 0.3–45 Hz) to get the desired signal in the band of 0.3–45 Hz.
Using ICA the signal has been decomposed into various independent components. Every independent component represented a source of activity. Depending on the source which may be signal or noise, the component has been accepted or rejected.
Let the signal recorded at the scalp is X (x1, x2, x3….). The number of sources lets be S (s1, s2, s3, s4, s5…) and each source is mixed by factors let A (a, b, c…). Hence, this can be represented mathematically: X=A*S.
ICA Implementation in EEGLAB
EEGLAB allows various file formats to be imported into the lab, we have used edf format. Data were first filtered and then the direct current component was removed from the signal. ICA algorithm was implemented. Noisy component was removed from the signal based on the scalp map. Figure 2 describes the process of artifact removal by ICA in MATLAB through the scalp map. The signal is now ready for feature extraction.
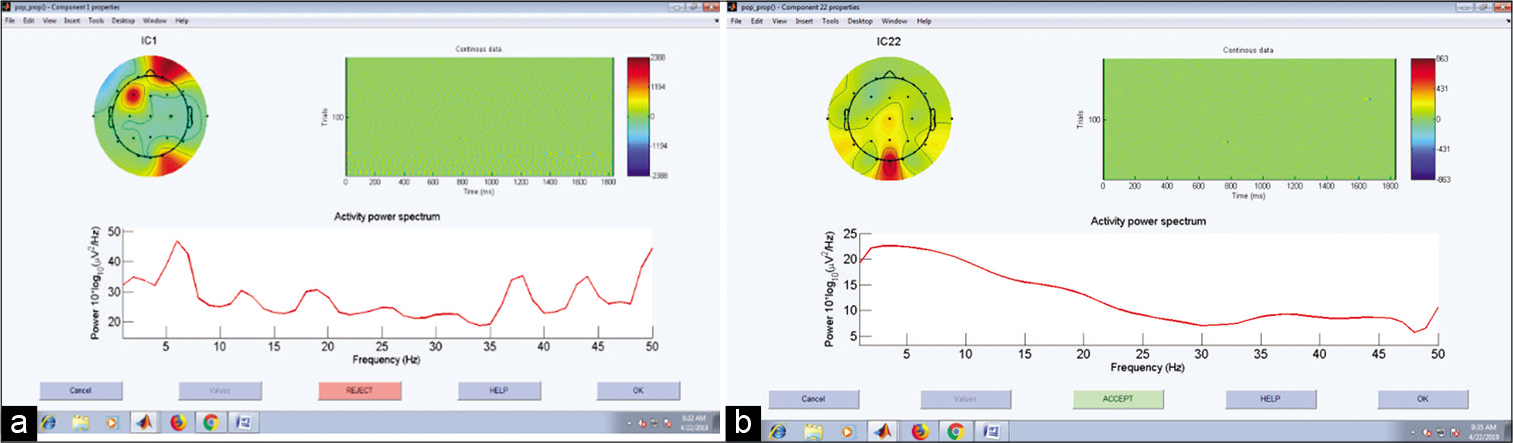
- Scalp map with (a) and without (b) eye blink artifact.
Feature extraction
Feature extraction is the process of extracting useful information from the signal.
Energy
Energy is defined as the strength of a signal. It is defined mathematically as follows: 1
As per Parseval’s theorem, the energy of the distorted signal can be partitioned at different resolution levels. Signal energy can be defined in the above equation.
i =1, 2……Where i = 1, 2…… is the wavelet decomposition level from level 1 to level. N is the number of the coefficients of detail or approximates at each disintegration level. is the energy of the particulars at disintegration level I and EAι is the energy of the approximate at decomposition level l (Omerhodzic et al., 2010; Kumar et al., 2017).[11,14]
Statistical analyses
IBM SPSS Statistics software has been used for the analysis of EEG data. A significance level of 0.05 has been taken with a confidence limit of 95% to delignate the statistical significance of any parameter.
RESULTS
A total of 115 subject’s EEG data have been recorded during the period of reference, out of which 19 subjects with generalized seizure have been taken as control and 11 subjects have been taken as study subject following inclusion and exclusion criteria. The mean age of experimental group was 10.1 years where as that of control group subjects were 11 years [Figure 3]. Rest of the data have been discarded due to presence of one or more biases.
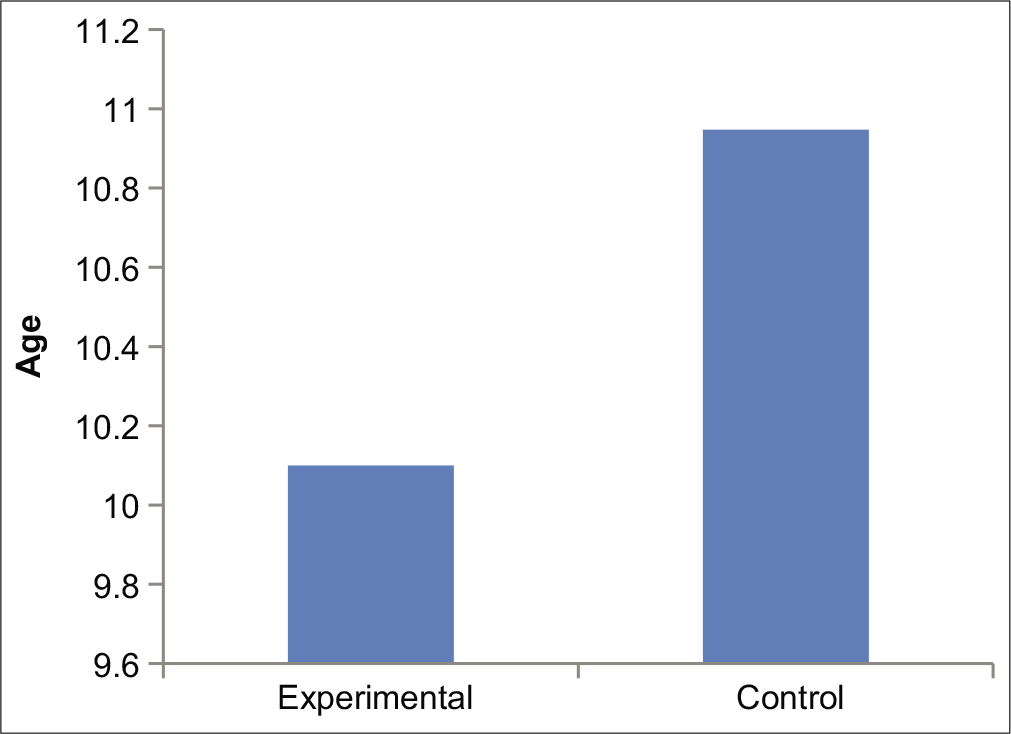
- Average age of experimental and control.
Further, data have been analyzed for energy of alpha, beta, theta, and delta waves. Mean energy level for alpha waves among control subjects was 9.78 ± 7.65 and that of study subject was 3.65 ± 2.38. Similarly, mean beta energy was 8.77 ± 6.10 for control and 4.83 ± 1.66 for test subjects. A significant reduction of alpha (P = 0.04) and beta waves (P = 0.004) was observed in the seizure group. The mean theta activity has been found slightly increased in in the experimental group in comparison to the control group, whereas the mean delta energy level showed slight decreased level, but both are statistically not significant [Table 1 and Figure 4].
| Waves | Mean of control | Mean of experimental | SD of control | SD of experimental | Significant value |
|---|---|---|---|---|---|
| Alpha | 9.78 | 3.65 | 7.65 | 2.38 | 0.047 |
| Beta | 8.77 | 4.83 | 6.10 | 1.66 | 0.004 |
| Theta | 5.92 | 7.29 | 4.22 | 5.33 | 0.133 |
| Delta | 13.50 | 11.51 | 13.21 | 9.16 | 0.715 |
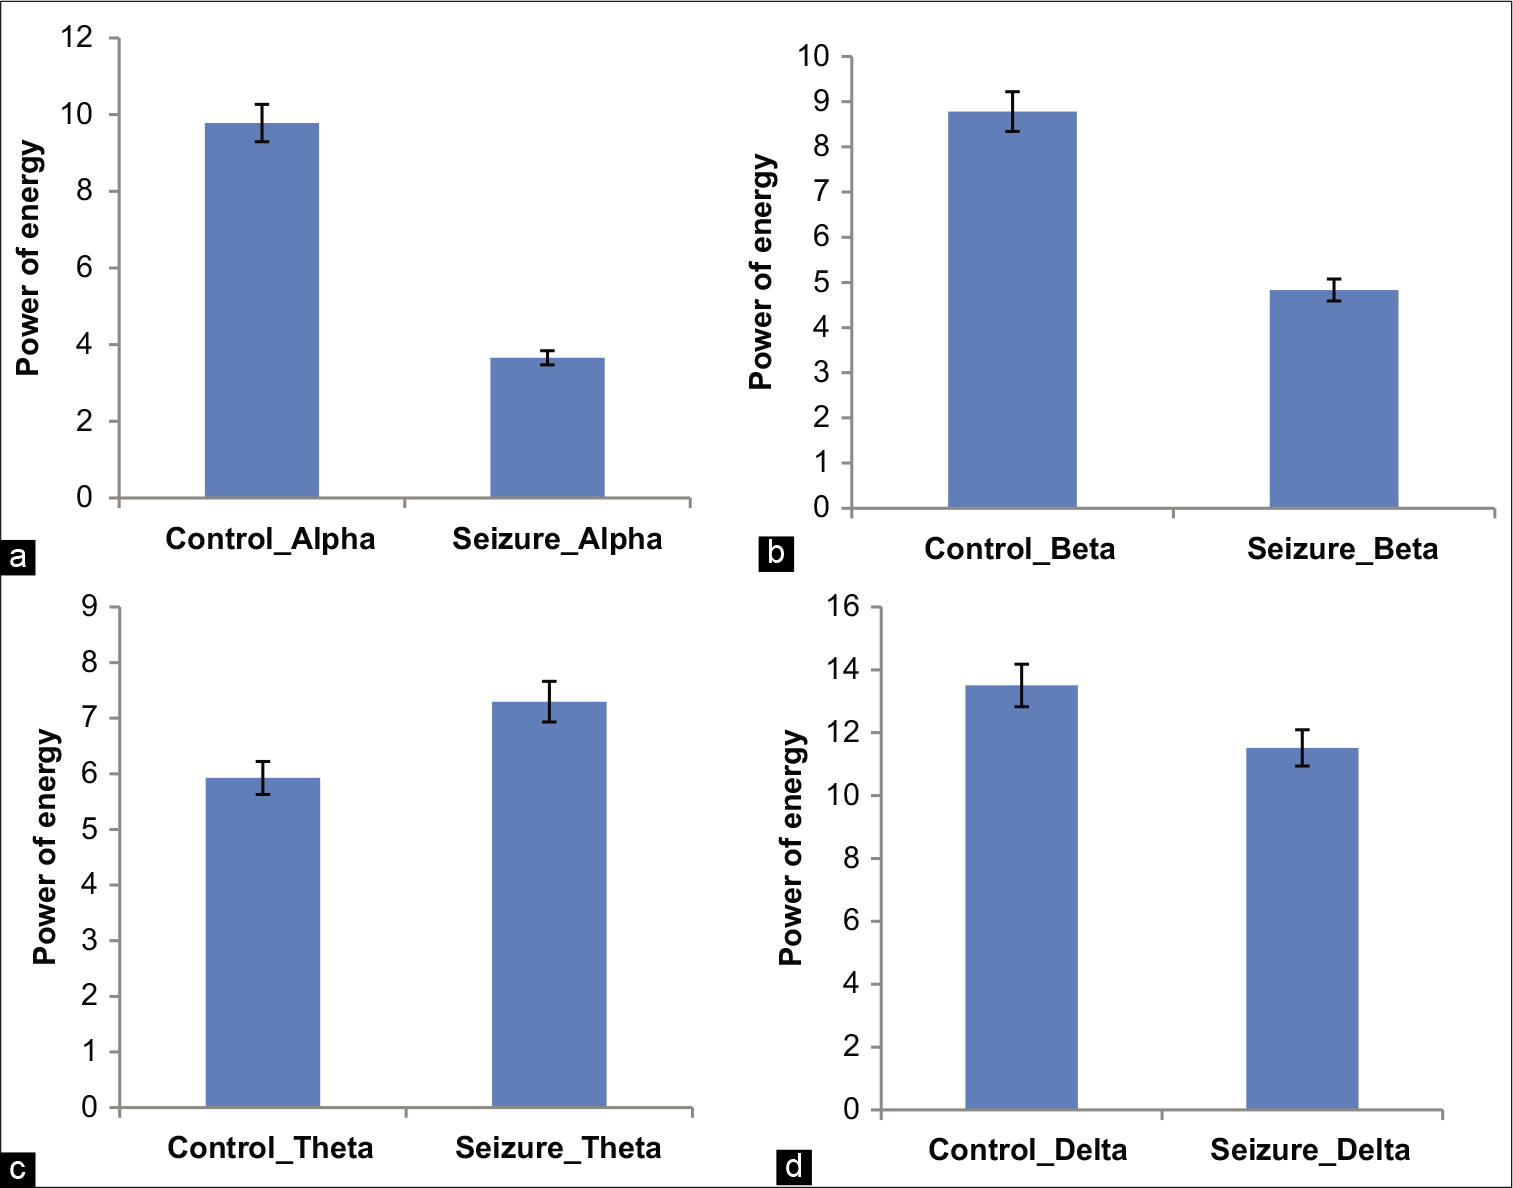
- Mean energy of α showing in figure (a), β showing in figure (b), θ showing in figure (c), and δ showing in figure (d), between normal and seizure with SD.
DISCUSSION
Electroencephalography is one of the most important tools for seizure detection used across the globe. Despite of lots of technological advancements, the EEG interpretation is largely subjective and diagnosis of seizure is mostly based on the subjective observations and clinical acumen of the clinician. The present study aimed to investigate the possibility of objective diagnosis of seizure possibly from the background electroencephalographic characteristics of the prospective seizure patients even before actual seizure events.
The pre-recorded EEG data and subject’s clinical information have been analyzed following due protocol to make a comparison between the electroencephalographic patterns of non-seizure subjects and EEG of subjects with history of recent seizure. From the results of the study, the following observations could be figured out.
The mean energy level of control subjects was higher than that of seizure patient even during non-electrophysiological seizure, but it was statistically insignificant
There was no statistically significant difference between the energy levels during pre-seizure and post-seizure electrical activity in the study subjects
Energy level in theta and delta band of control and study subject did not had statistically significant difference
The energy level for alpha and beta frequency band in seizure group subjects was much lower in comparison to the control group subjects when the EEG segments taken for analysis was from the period of electrical seizure activities
Entropy, which signifies randomness of the brain electrical activity, did not show any significant difference between the control subject and study subjects.
From the above observations, it is apparent that out of the two important parameters of the electroencephalographic signals studied, that is, energy and entropy, energy has come out as most important discriminator between the seizure and non-seizure categories. The energy of the filtered EEG signals has the optimal discriminative capability under the extreme energy difference (EED) criterion, and thus, EED can be considered as a feature extractor (Li and Sun., 2008).[15] The previous study reported that seizure EEG changes are indicative of increased excitability, distorted synchrony, and decreased signal complexity for the period of a pre-seizure (Mormann et al., 2006 and Zaveri et al., 2009).[16,17] As the EEG signal is a kind of non-linear signal, its dispersion characteristics are complex and difficult to estimate.[18] The seizure subset of the data has shown a decreased mean level of energy in comparison to the non-seizure subset of individuals which were contrary to the common expectation and scientific believes. This may be attributed to the complex neural behaviors related to dispersion. The other parameter, the entropy, which is a measure of complexity did not show any significant difference between seizure and non-seizure individuals. This indicates that there is no any significant change in the signal characteristics of the background electrical activities among seizure patients in comparison to normal individuals. Another interesting and rather robust methodology for objective tool for seizure detection could be the multichannel surface EEG-based patient non-specific seizure detection approach. This approach includes DMD power, power spectral density, variance, and KFD extracted from WPD coefficients measurement for detecting seizure. In any continuous EEG signal seizure, event may be observed for seconds as compared to many minutes of non-seizure EEG signals (Dash et al., 2019).[19] Hence, cluster-based seizure classification is preferred. Based on the observation, a future study with bigger database could be attempted with combined approach.
CONCLUSION
This a small retrospective study on the pre-recorded data to find if the normal background characteristics of an EEG signal be used for seizure detection and prediction. The study indicated changes in the energy level between the EEG characteristics of non-seizure subjects and that of seizure individuals. Further, a study will be required for better understanding the underlying mechanism.
ACKNOWLEDGMENTS
The authors wish to acknowledge the immense contribution of all the faculty members, staff of the department of physiology, and the contribution of the patients who consented for the study.
Declaration of patient consent
Patient’s consent not required as patients identity is not disclosed or compromised.
Financial support and sponsorship
Nil.
Conflicts of interest
There are no conflicts of interest.
References
- A machine learning system for automated whole-brain seizure detection. Appl Comput Inform. 2016;12:70-89.
- [CrossRef] [Google Scholar]
- Social media in epilepsy: A quantitative and qualitative analysis. Epilepsy Behav. 2017;71:79-84.
- [CrossRef] [PubMed] [Google Scholar]
- Revised terminology and concepts for organization of seizures and epilepsies: Report of the ILAE commission on classification and terminology, 2005-2009. Epilepsia. 2010;51:676-85.
- [CrossRef] [PubMed] [Google Scholar]
- Classifications of seizures and epilepsies, where are we?-a brief historical review and update. J Formos Med Assoc. 2017;116:736-41.
- [CrossRef] [PubMed] [Google Scholar]
- Automatic seizure detection: Improvements and evaluation. Electroencephalogr Clin Neurophysiol. 1989;76:317-24.
- [CrossRef] [Google Scholar]
- Quantitative pharmaco-electroencephalography in antiepileptic drug research. CNS Drugs. 2018;32:839-48.
- [CrossRef] [PubMed] [Google Scholar]
- Uterine activity during pregnancy and labor assessed by simultaneous recordings from the myometrium and abdominal surface in the rat. Am J Obstet Gynecol. 1998;178:811-22.
- [CrossRef] [Google Scholar]
- Use of the electrohysterogram signal for characterization of contractions during pregnancy. IEEE Trans Biomed Eng. 1999;46:1222-9.
- [CrossRef] [PubMed] [Google Scholar]
- Characterization of abdominally acquired uterine electrical signals in humans, using a non-linear analytic method. Med Biol Eng Comput. 2006;44:117-23.
- [CrossRef] [PubMed] [Google Scholar]
- Classification of uterine EMG Signals using supervised classification method. J Biomed Sci Eng. 1998;3:837-42.
- [CrossRef] [Google Scholar]
- Energy distribution of EEG signals: EEG signal wavelet-neural network classifier. World Acad Sci Eng Technol. 2010;61:1190-5.
- [Google Scholar]
- Wavelet preprocessing for automated neural network detection of EEG spikes. IEEE Eng Med Biol. 1995;14:160-6.
- [CrossRef] [Google Scholar]
- Recurrent neural network based prediction of epileptic seizures in intra-and extracranial EEG. Neurocomputing. 2000;30:201-18.
- [CrossRef] [Google Scholar]
- Effect of immersion (2D vs. 3D) on attention through virtual reality. Int J Sci Res. 2017;6:204-7.
- [Google Scholar]
- Energy Feature Extraction of EEG Signals and a Case Study Hong Kong, China: IEEE World Congress on Computational Intelligence; 2009.
- [Google Scholar]
- Seizure anticipation: From algorithms to clinical practice. Curr Opin Neurol. 2006;19:187-93.
- [CrossRef] [PubMed] [Google Scholar]
- A decrease in EEG energy accompanies anti-epileptic drug taper during intracranial monitoring. Epilepsy Res. 2009;86:153-62.
- [CrossRef] [PubMed] [Google Scholar]
- Electrical Fields of the Brain: The Neurophysics of EEG (2nd ed). Oxford, England: Oxford University Press; 2006.
- [Google Scholar]
- Hidden Markov model based epileptic seizure detection using tunable Q wavelet transform. J Biomed Res. 2020;34:170-9.
- [CrossRef] [PubMed] [Google Scholar]