Translate this page into:
Diversity in United States medical faculty relative to population trends, 2005–2019
*Corresponding author: Ashwani K. Sharma, Department of Imaging Sciences, University of Rochester, Rochester, United States. aksharma73@gmail.com
-
Received: ,
Accepted: ,
How to cite this article: Baran TM, Wicks JS, Sharma AK. Diversity in United States medical faculty relative to population trends, 2005–2019. Indian J Med Sci 2023;75:197-9.
Abstract
Increasing diversity is essential not only for equal healthcare among all individuals but also for equal socio-economic potential for all genders and ethnicities. With changing demographics over the years, we tried to assess the impact of university programs for the promotion of equality in ethnic representation in the medical community. The US population, based on the data taken from the US Census Bureau, was compared to the Faculty Administrative Management Online User System (FAMOUS) data to analyze the representation of the medical community to the general US population. Females have reached near parity in their representation within the medical community faculty. Underrepresented in medicine individuals have not come far enough to reach parity in their representation within the medical community. As compared to the general US population, while Asians are overrepresented, Black and Hispanic proportions in the medical community are still underrepresented.
Keywords
Blacks in medical faculty
Hispanics in medical faculty
Females in medical faculty
Medical faculty
Diversity

INTRODUCTION
In the United States, certain racial and ethnic groups are heavily underrepresented in medicine (URM) compared to population demographics.[1] Although there has been considerable growth in female representation in some sub-specialties,[2-4] there is still no parity with the population. Although others have investigated trends in diversity by reporting proportions,[4] a misleading narrative can be created by noting increasing URM counts without comparing them to population trends. To capture the wide gap between the racial, ethnic, and gender makeup of the US population and the academic medical profession, we perform a direct comparison using data from two databases: The US Census and the Association of American Medical Colleges (AAMC) Faculty Roster (FAMOUS) database. We compare the proportions of ethnic and gender groups between the two datasets, both overall and at specific academic ranks.
MATERIAL AND METHODS
This retrospective study analyzed US allopathic medical school faculty diversity using data from AAMC FAMOUS.[5] Access to FAMOUS data from 2005 to 2019 was granted by the AAMC, which contained aggregate counts of faculty based on professorship rank, ethnicity, and gender. US population data were acquired from the US Census Bureau from the year 2019.[6]
Proportions of racial/ethnic/gender groups were compared between FAMOUS and US census data, and between 2005 and 2019 FAMOUS data, using the Chi-squared test. Relationships between proportions and years were modeled with linear regression. Statistical analysis was performed with GraphPad Prism (v6, GraphPad Software, Inc.) and MATLAB (R2019b, Mathworks). The study was reviewed and declared exempt by our institutional review board.
RESULTS
Racial and ethnic representation
Compared to 2019 Census data, Asian and White individuals are over-represented (Asian: 21.0% vs. 5.9%, P < 0.0001; White: 66.1% vs. 60.1%, P < 0.0001), while Black and Hispanic groups are under-represented (Black: 3.8% vs. 13.4%, P < 0.0001; Hispanic: 3.4% vs. 18.5%, P < 0.0001), in total professorships. These trends persist at all academic levels [Table 1a and Figure 1a].
| 2005 FAMOUS (%) | 2019 FAMOUS (%) | Difference 2005–2019 (%) | 2019 census (%) | |
|---|---|---|---|---|
| Full professor | ||||
| Asian | 2049 (7.1) | 5384 (14.0) | 3335 (+6.9)* | 5.9† |
| Black | 409 (1.4) | 778 (2.0) | 369 (+0.6)* | 13.4† |
| Hispanic | 514 (1.8) | 1026 (2.7) | 512 (+0.9)* | 18.5† |
| White, non-Hispanic | 25047 (86.7) | 29808 (77.3) | 4761 (−9.4)* | 60.1† |
| Total (all races/ethnicities) | 28888 | 38547 | 9659 | 328239523 |
| Associate professor | ||||
| Asian | 2785 (10.8) | 7641 (20.8) | 4856 (+10.0)* | 5.9† |
| Black | 736 (2.9) | 1272 (3.5) | 536 (+0.6)* | 13.4† |
| Hispanic | 743 (2.9) | 1243 (3.4) | 500 (+0.5)* | 18.5† |
| White, Non-Hispanic | 20665 (80.4) | 24721 (67.2) | 4056 (−13.2)* | 60.1† |
| Total (all races/ethnicities) | 25695 | 36801 | 11106 | 328239523 |
| Assistant professor | ||||
| Asian | 9148 (18.8) | 20293 (24.3) | 11142 (+5.5)* | 5.9† |
| Black | 2225 (4.6) | 3947 (4.7) | 1722 (+0.1) | 13.4† |
| Hispanic | 1732 (3.6) | 3160 (3.8) | 1428 (+0.2)* | 18.5† |
| White, Non-Hispanic | 33268 (68.2) | 50642 (60.5) | 17374 (−7.7)* | 60.1† |
| Total (all races/ethnicities) | 48770 | 83658 | 34885 | 328239523 |
| Table 1b: Separated by gender. | ||||
| 2005 FAMOUS | 2019 FAMOUS | Difference | 2019 census | |
| Full professor | ||||
| Male | 24541 (83.7) | 28955 (73.9) | 4414 (−9.8)* | 49.2† |
| Female | 4793 (16.3) | 10245 (26.1) | 5452 (+9.8)* | 50.8† |
| Total | 29334 | 39200 | 9866 | 328239523 |
| Associate professor | ||||
| Male | 18828 (71.7) | 22952 (60.8) | 4124 (−10.9)* | 49.2† |
| Female | 7415 (28.3) | 14796 (39.2) | 7381 (+10.9)* | 50.8† |
| Total | 26243 | 37748 | 11505 | 328239523 |
| Assistant professor | ||||
| Male | 30944 (61.2) | 45519 (52.4) | 14575 (−8.8)* | 49.2† |
| Female | 19615 (38.8) | 41403 (47.3) | 21788 (+8.8)* | 50.8† |
| Total | 50559 | 86922 | 36363 | 328239523 |
Professorship by rank, year, and (a) race/ethnicity or (b) gender. Derived from AAMC: Faculty Roster, December 31 snapshots, as of September 30, 2020. Data are presented as numbers (percentage of total). *Significant difference (P<0.05) between 2005 and 2019 FAMOUS data. †Significant difference (P<0.05) between 2019 FAMOUS and Census data
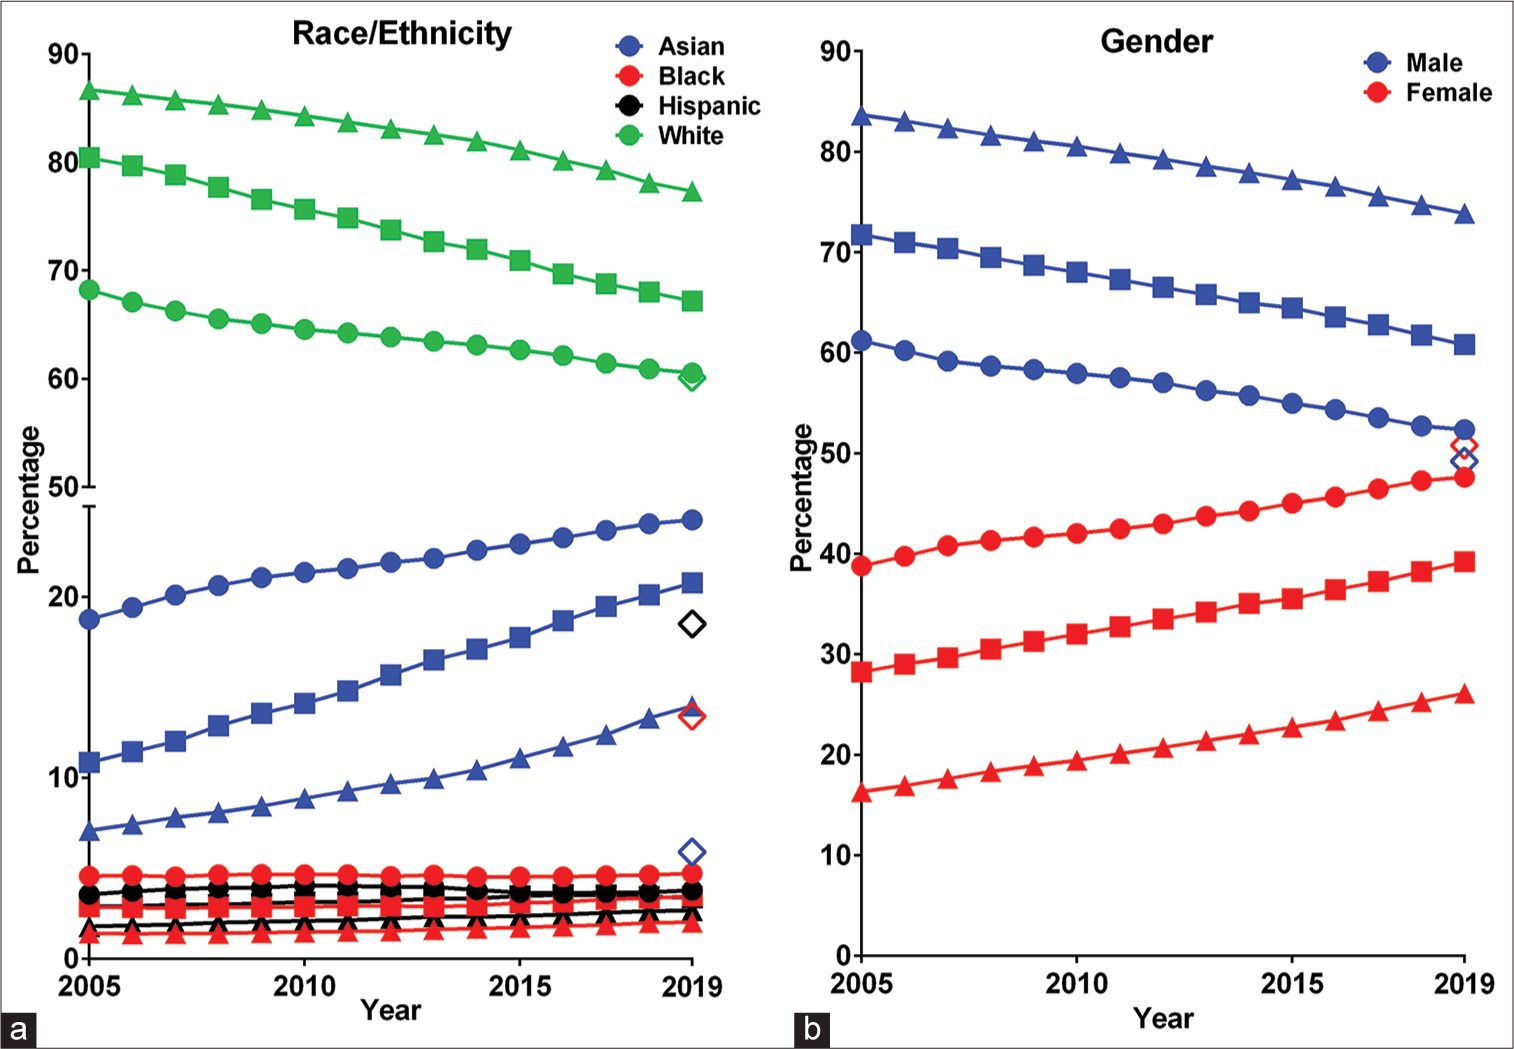
- Proportions of Full Professorships, Associate Professorships, and Assistant Professorships by year for (a) the four largest races/ ethnicities and (b) gender. Closed symbols indicate academic rank (Circle: Assistant Professor, Square: Associate Professor, Triangle: Full Professor), while colors indicate race/ethnicity or gender. Open diamonds represent corresponding 2019 U.S. Census data.
Longitudinally, over-representation of Asian individuals has increased at all ranks (Full: 0.47%/year [0.43–0.52 95% confidence interval, CI], P < 0.0001; Associate: 0.72%/year [0.71–0.74 95% CI], P < 0.0001; Assistant: 0.37%/year [0.34–0.39 95% CI], P < 0.0001). Black representation has slightly increased at full and associate professorship ranks (Full: 0.05%/year [0.04–0.05 95% CI], P < 0.0001; Associate: 0.04%/year [0.03– 0.05 95% CI], P < 0.0001), but remained constant for assistant professorships (0.001%/year [−0.01–0.01 95% CI], P = 0.75).
Gender representation
Females are under-represented compared to males at all levels (P < 0.0001 for all, [Table 1b and Figure 1b]). All professorship ranks have trended toward parity, with female proportions increasing at 0.68%/year (0.66–0.71 95% CI, P < 0.0001), 0.76%/year (0.75–0.78 95% CI, P < 0.0001), and 0.60%/year (0.57–0.63 95% CI, P < 0.0001) for full, associate, and assistant professor, respectively.
DISCUSSION
Our 14-year longitudinal study indicates a continued lack of diversity within U.S. academic medical faculty. Black and Hispanic physicians are not reaching parity with the general population. Asians are becoming more overrepresented, and Whites are trending toward proportional representation. Trends for gender equality are encouraging, though women are still under-represented at all levels.
These trends in racial and gender representation were previously examined for specific sub-specialties. Results were positive for gender representation, particularly for family medicine,[2] obstetrics-gynecology,[3] and dermatology.[4] However, while proportions of URM in many sub-specialties have increased, these groups are still significantly under-represented compared to population rates, with a prior study finding that URM representation is decreasing relative to population trends.[1]
We acknowledge several limitations in the present study. The use of US Census data can introduce sampling bias, discount some individuals, and categorization may not be specific enough, resulting in some sub-populations being combined. FAMOUS data were voluntarily collected, which may introduce systematic gaps. Finally, we acknowledge the relative simplicity of comparison to census data.
CONCLUSION
Through our longitudinal studies, it is confirmed that a lack of diversity continues to exist in the medical community for URM physicians and in some cases for women physicians. In light of this study, we recommend more work be done at the community level, in undergraduate university education, in medical school, and in academic research institutions as a necessary step to increase diversity in the medical community as a whole and in particular the leadership/senior positions within the medical community.
Declaration of patient consent
Patient’s consent not required as there are no patients in this study.
Conflicts of interest
There are no conflicts of interest
Financial support and sponsorship
Nil.
References
- Declining racial and ethnic representation in clinical academic medicine: A longitudinal study of 16 US medical specialties. PLOS One. 2018;13:e0207274.
- [CrossRef] [PubMed] [Google Scholar]
- Increasing family medicine faculty diversity still lags population trends. J Am Board Fam Med. 2017;30:100-3.
- [CrossRef] [PubMed] [Google Scholar]
- Diversity of physician faculty in obstetrics and gynecology. J Reprod Med. 2016;61:22-6.
- [Google Scholar]
- US dermatology department faculty diversity trends by sex and underrepresented-in-medicine status, 1970 to 2018. JAMA Dermatol. 2020;156:280-7.
- [CrossRef] [PubMed] [Google Scholar]
- Faculty Roster. Available from: https://www.aamc.org/data/facultyroster [Last accessed on 2020 Sep30]
- [Google Scholar]
- Quick Facts. Available from: https://www.census.gov/quickfacts/fact/table/US/POP645218#POP645218 [Last accessed on 2021 May25]
- [Google Scholar]